RhythmofMyBody
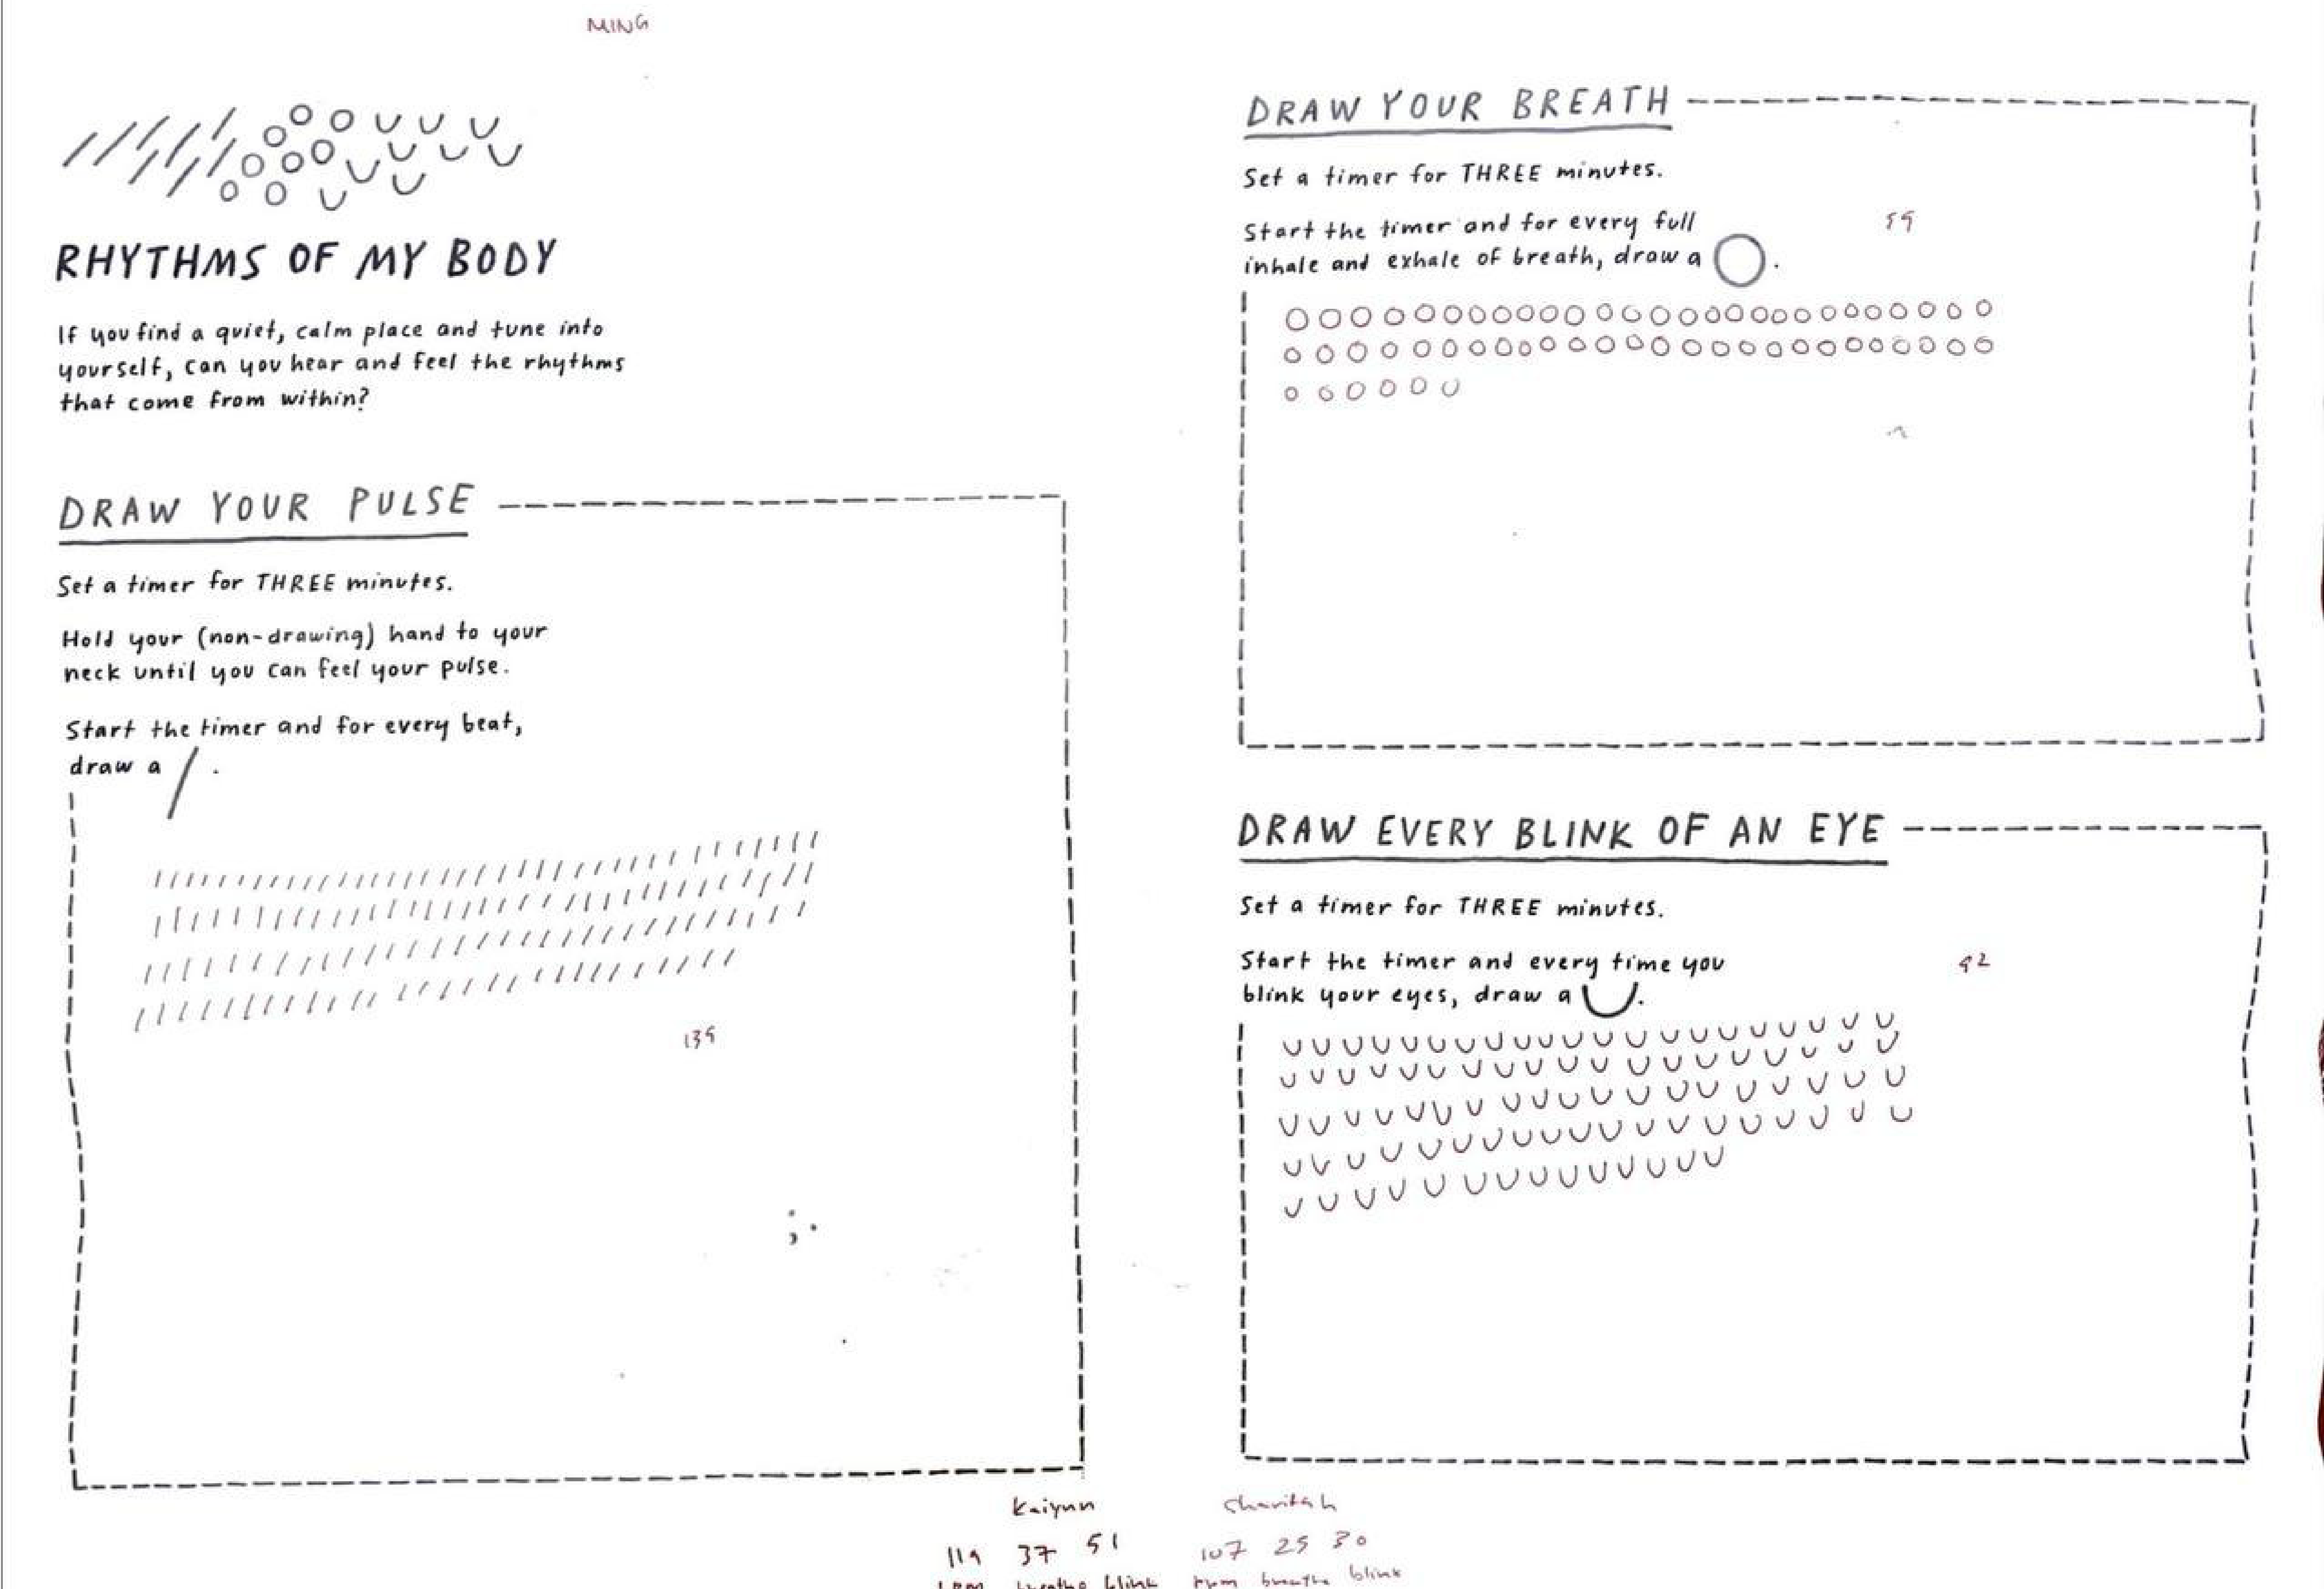
Experiment 1 visualises the data of the members of the group, where the data taken from our counts of breath, pulses and blinks were recorded within 3 minutes. This was the first experiment of the Data Spaces project, where we utilised basic shapes to animate the data recorded.
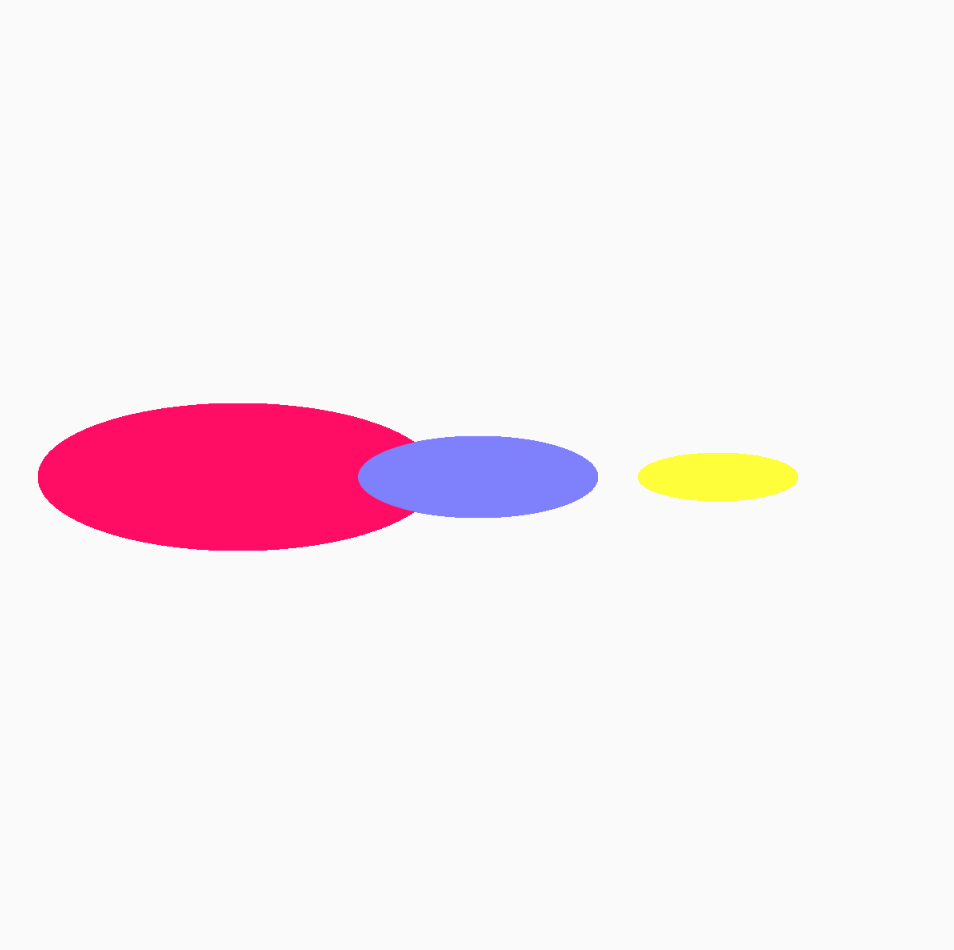

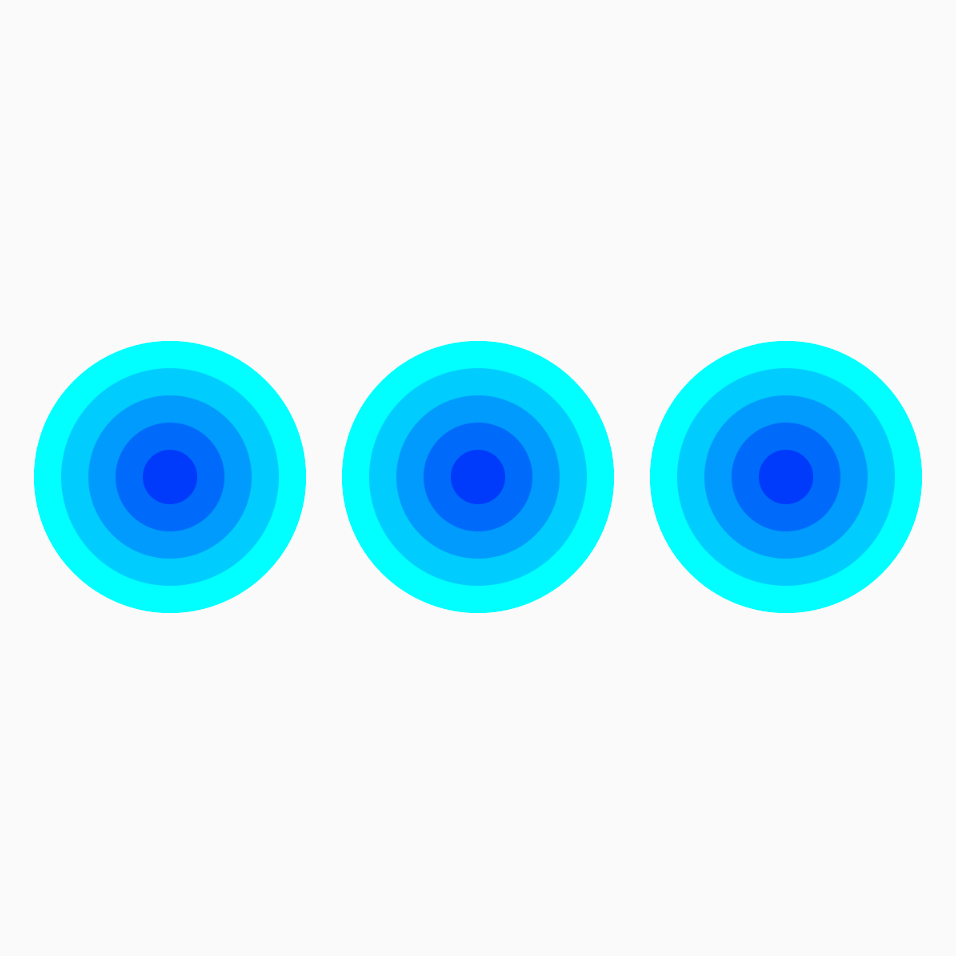
We began by creating the sketches individually without delegating the tasks of who to code for breath, pulses, and blinks. However by the end of it, we all somehow came up with sketches that utilise ellipses to visualise the data.
The data recorded by the three of us for this experiment are as follows : [119, 107, 139 (pulse)], [37, 25, 59 (breath)], and [51, 30, 92 (blink)].
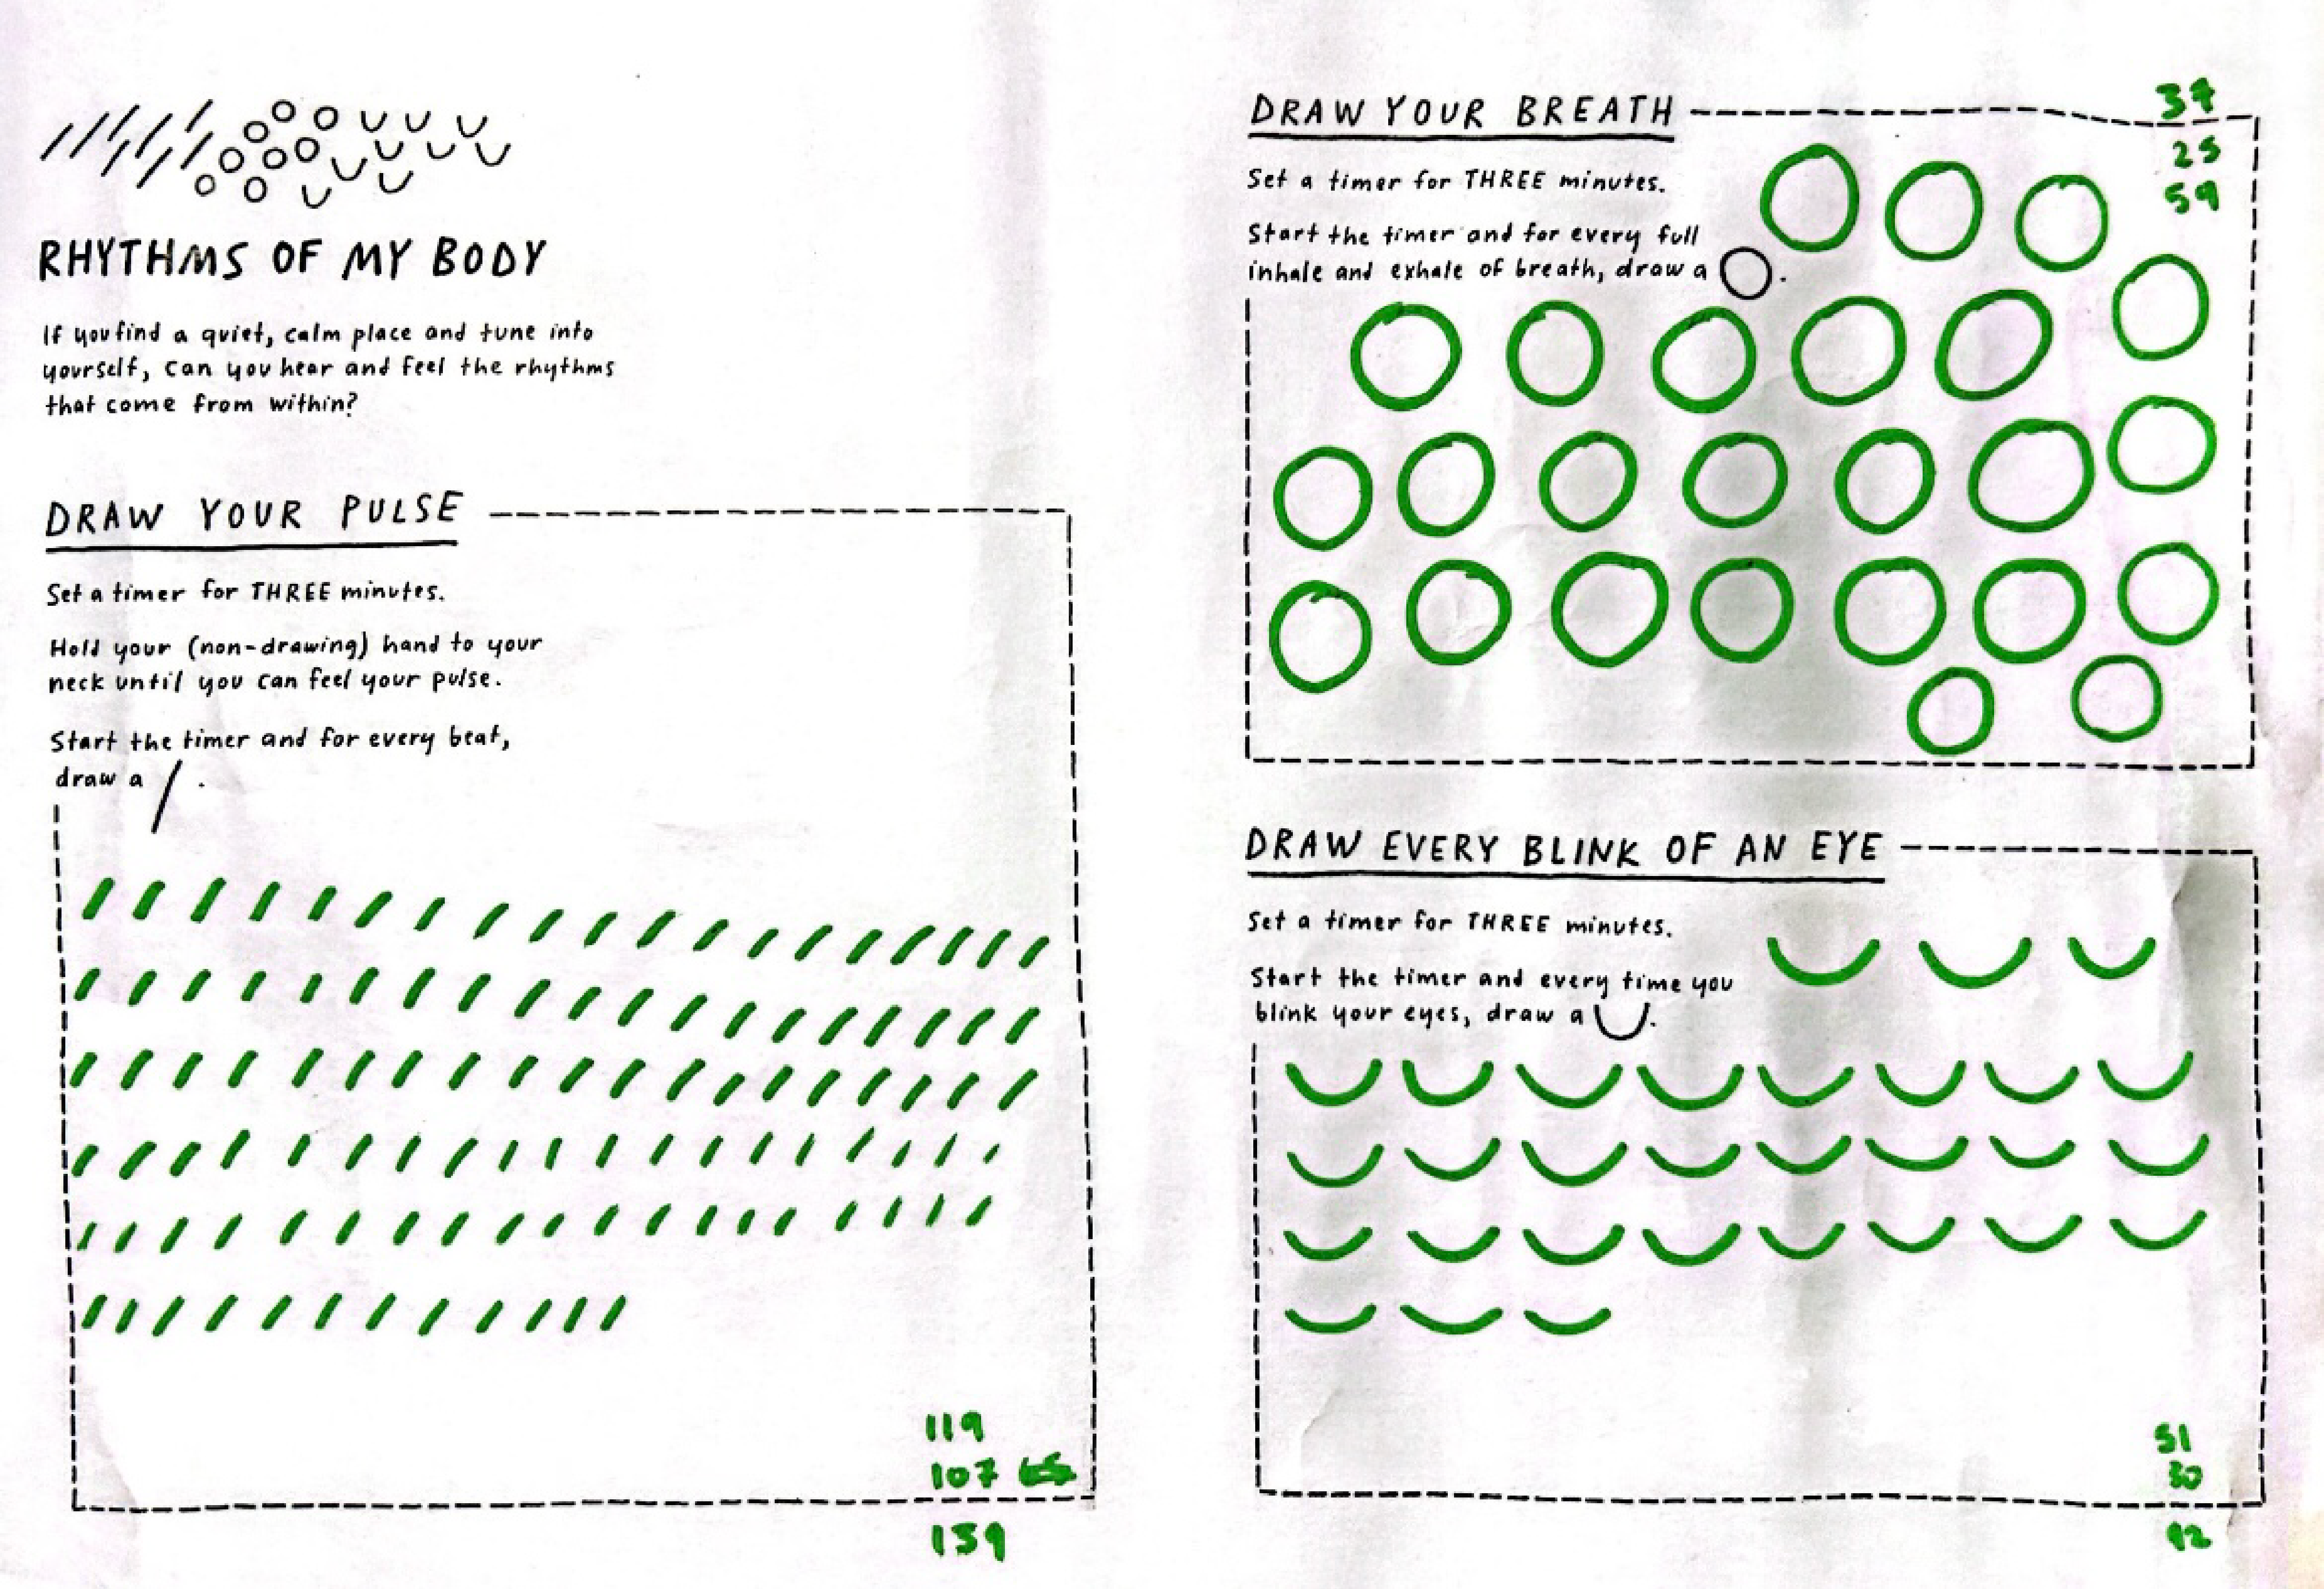
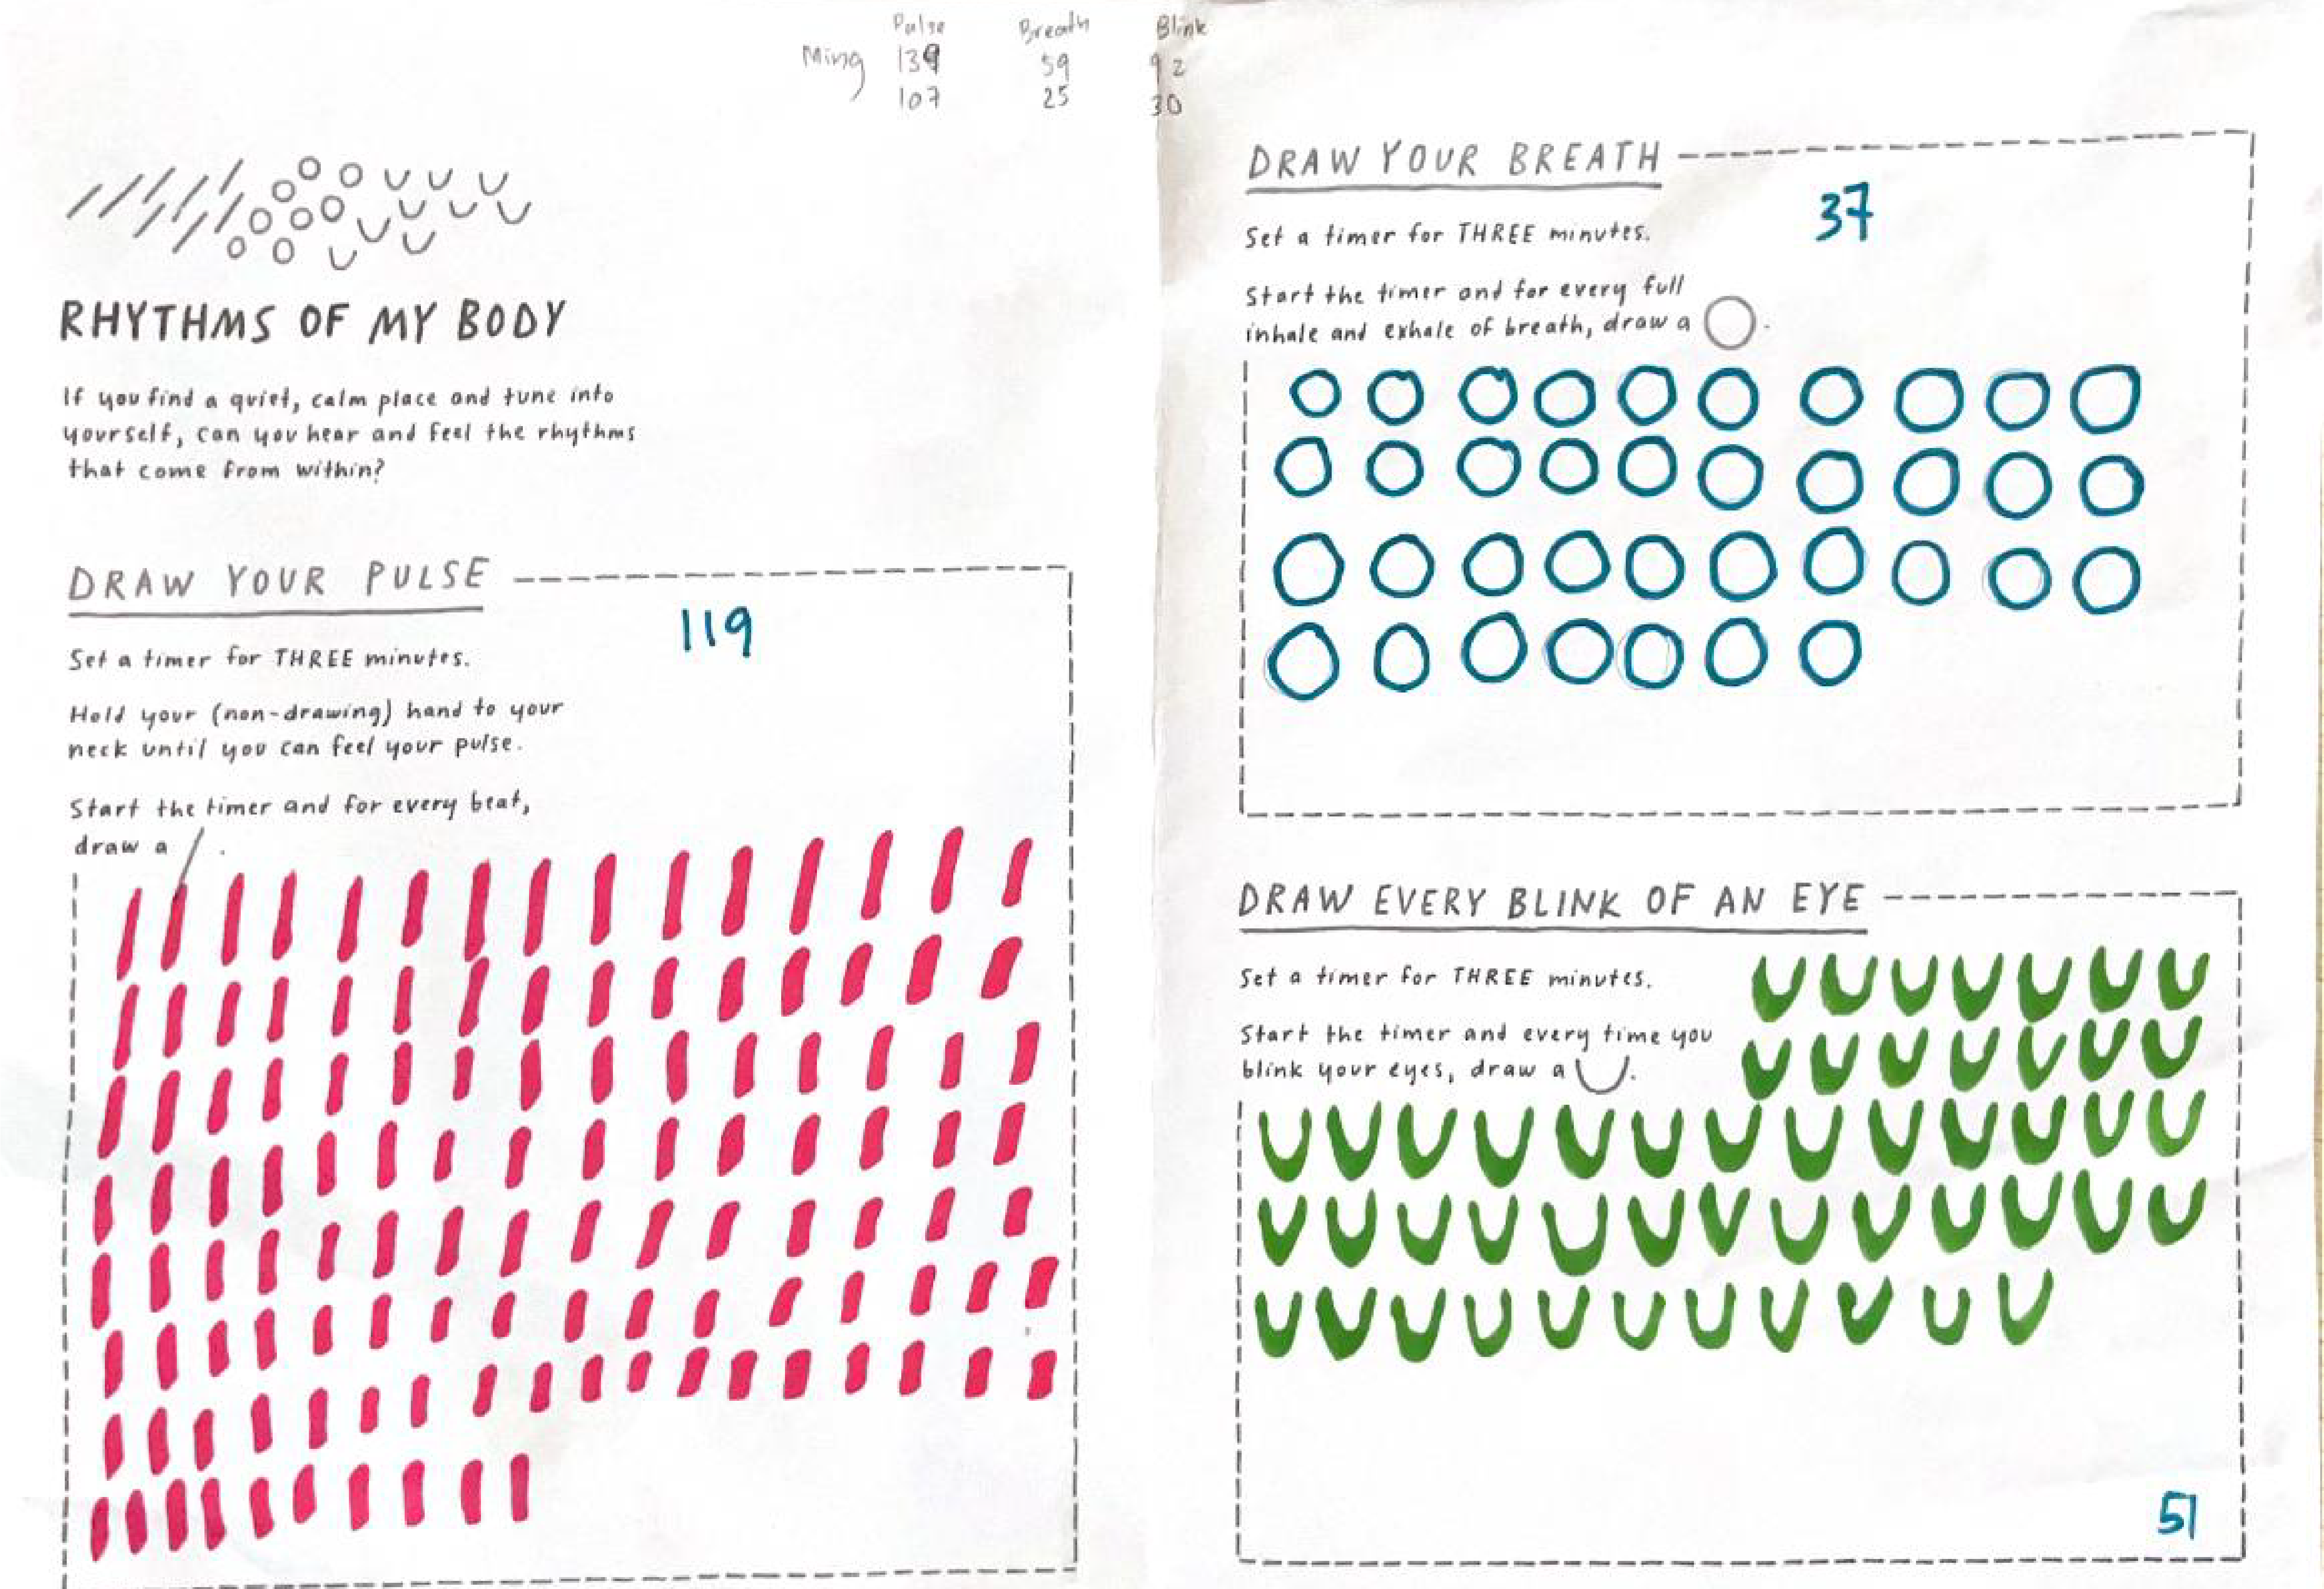
As p5.js was new to us, we tried to keep the sketch as simple as possible to ensure that our data could still be read easily. As the first experiment, we felt that this was an enjoyable way for us to kickstart the project and explore various ways to visualise data on p5.js.