Interconnected
Interconnected explores the interconnection between humans and the internet. In this experiment, we integrated the Arduino kit to p5.js to create an interactive data visualisation artwork.
-
The Internet & Us
This experiment aims to explore the concept of the internet and the time any of us would take in our day to use it. We aim to capture the timespan whenever we click a post on social media, or even when we are doomscrolling on TikTok. With that, we visualise the action of clicking a button, or pressing a screen and an ellipse will form. After numerous clicks, the screen will eventually be covered with blue streaks, symbolising the amount of interaction we have on the internet.
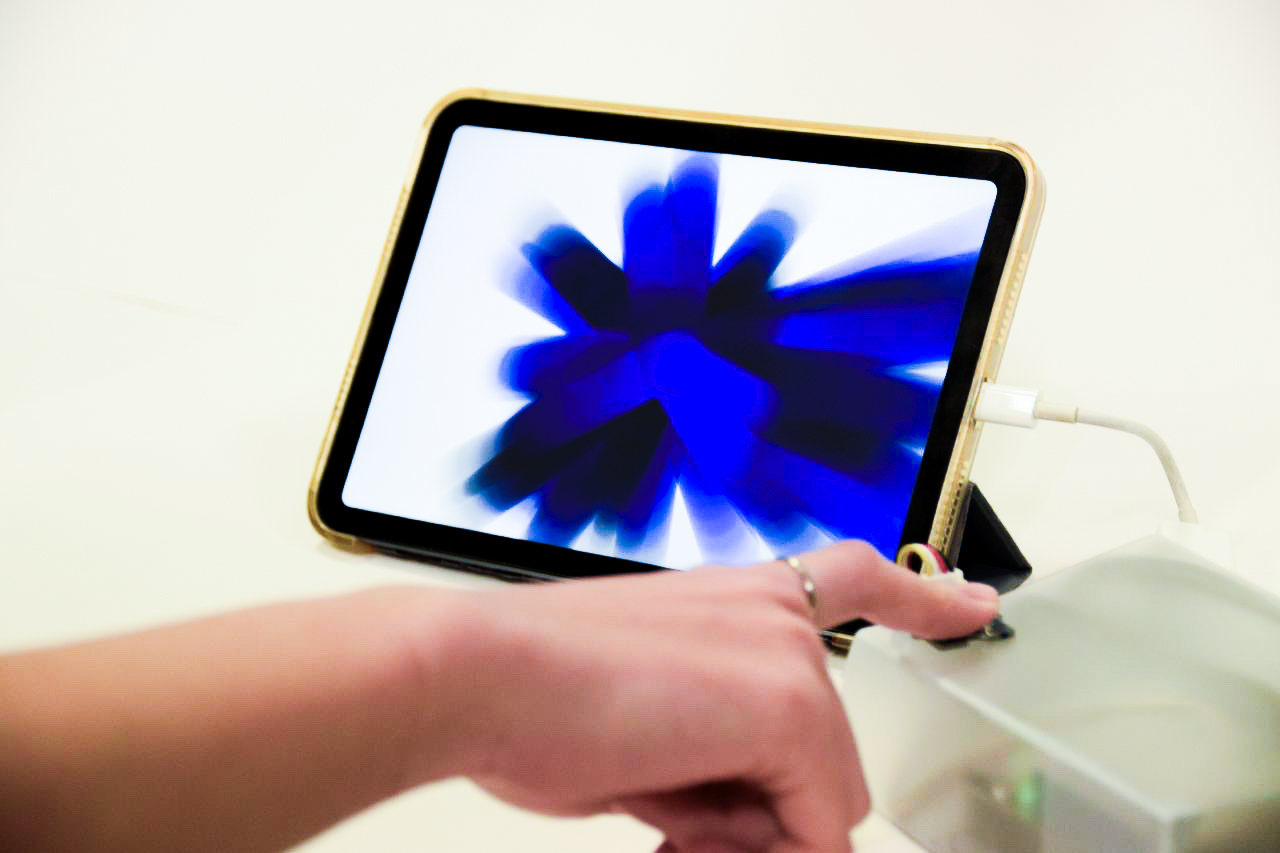
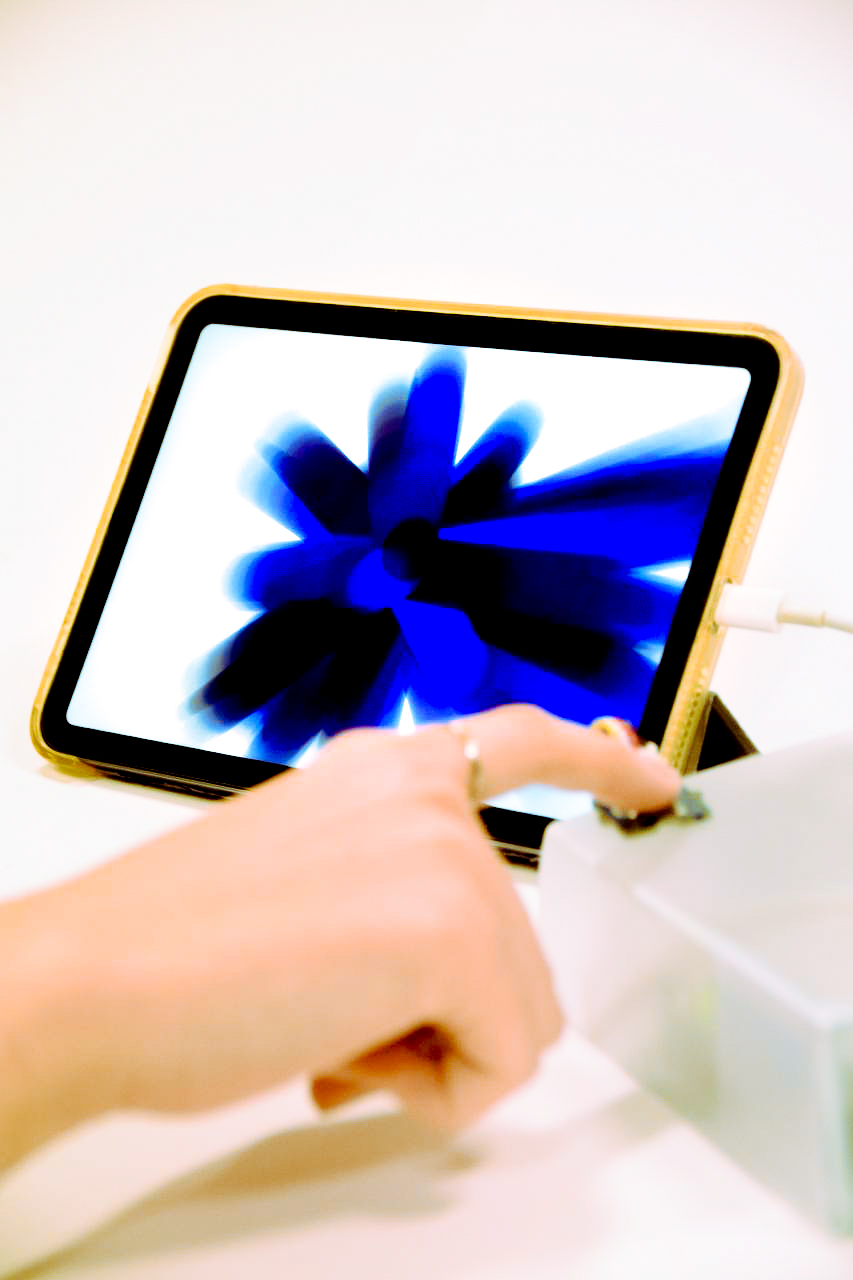
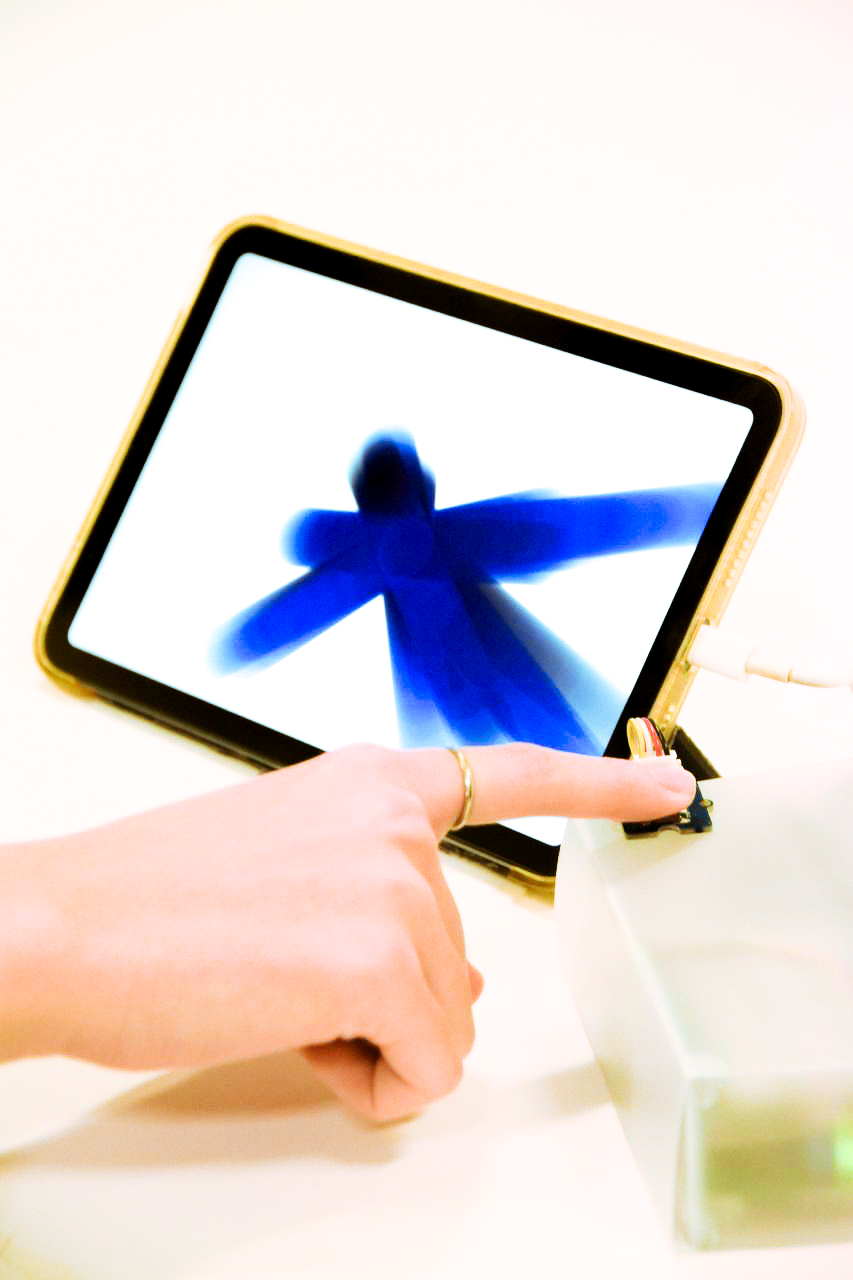
As seen above, when we pressed the button extension of the Arduino kit, the blue streak will appear from the center of the screen, and will shoot outwards in random direction.
As a group, we felt that it was not easy to integrate the interactions from the Arduino kit to p5.js. We did explore adding in the codes to p5.js and using the template to see how the codes can interact with the arduino extensions. However, it was not exactly the direction we wanted to take for this experiment. After addressing our concerns and with a (not so) little help, we were able to get the final codes.