DataRipple
Similar to Experiment 1, this experiment focuses on the data visualisation of our breaths, pulses, and blinks counts. However, this time round we take in the data of the entire class collectively. Instead of working with data from 3 individuals, we worked with data of 20 individuals.
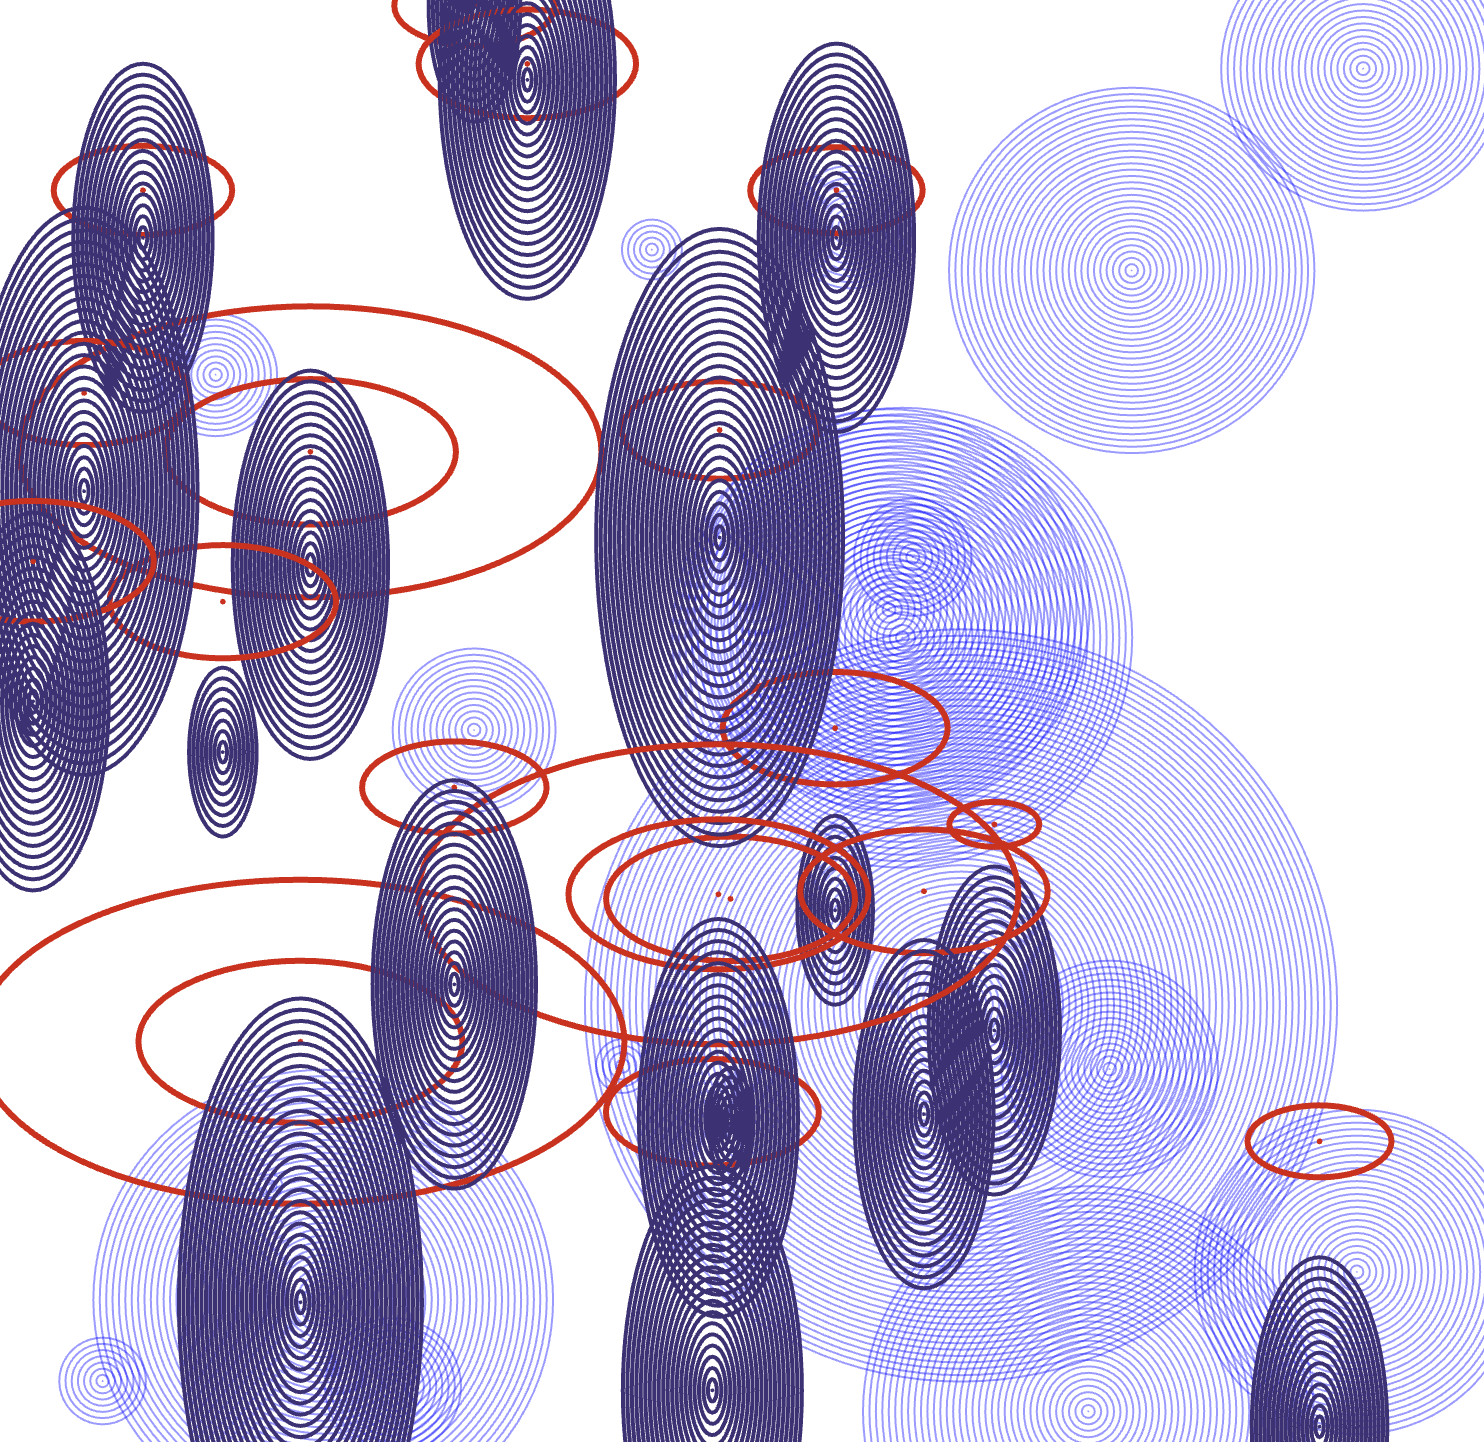
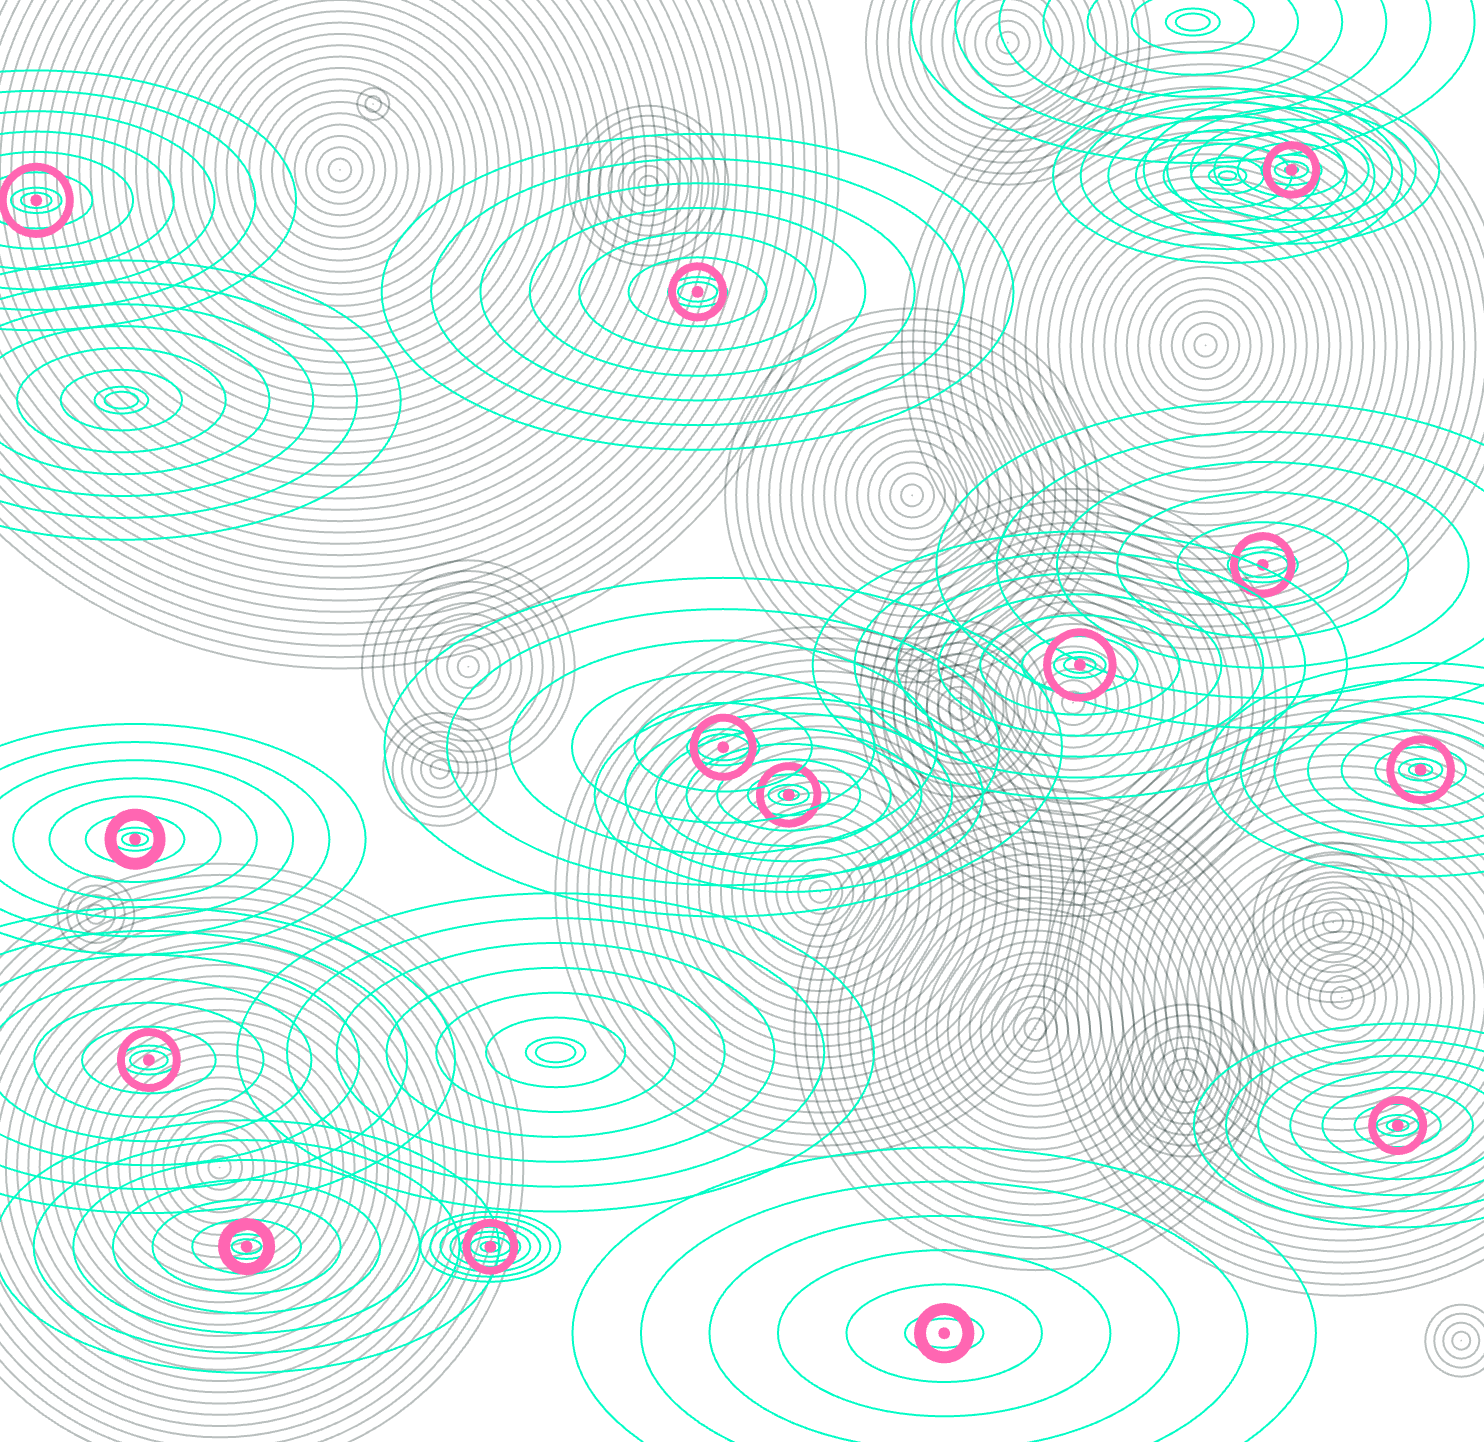
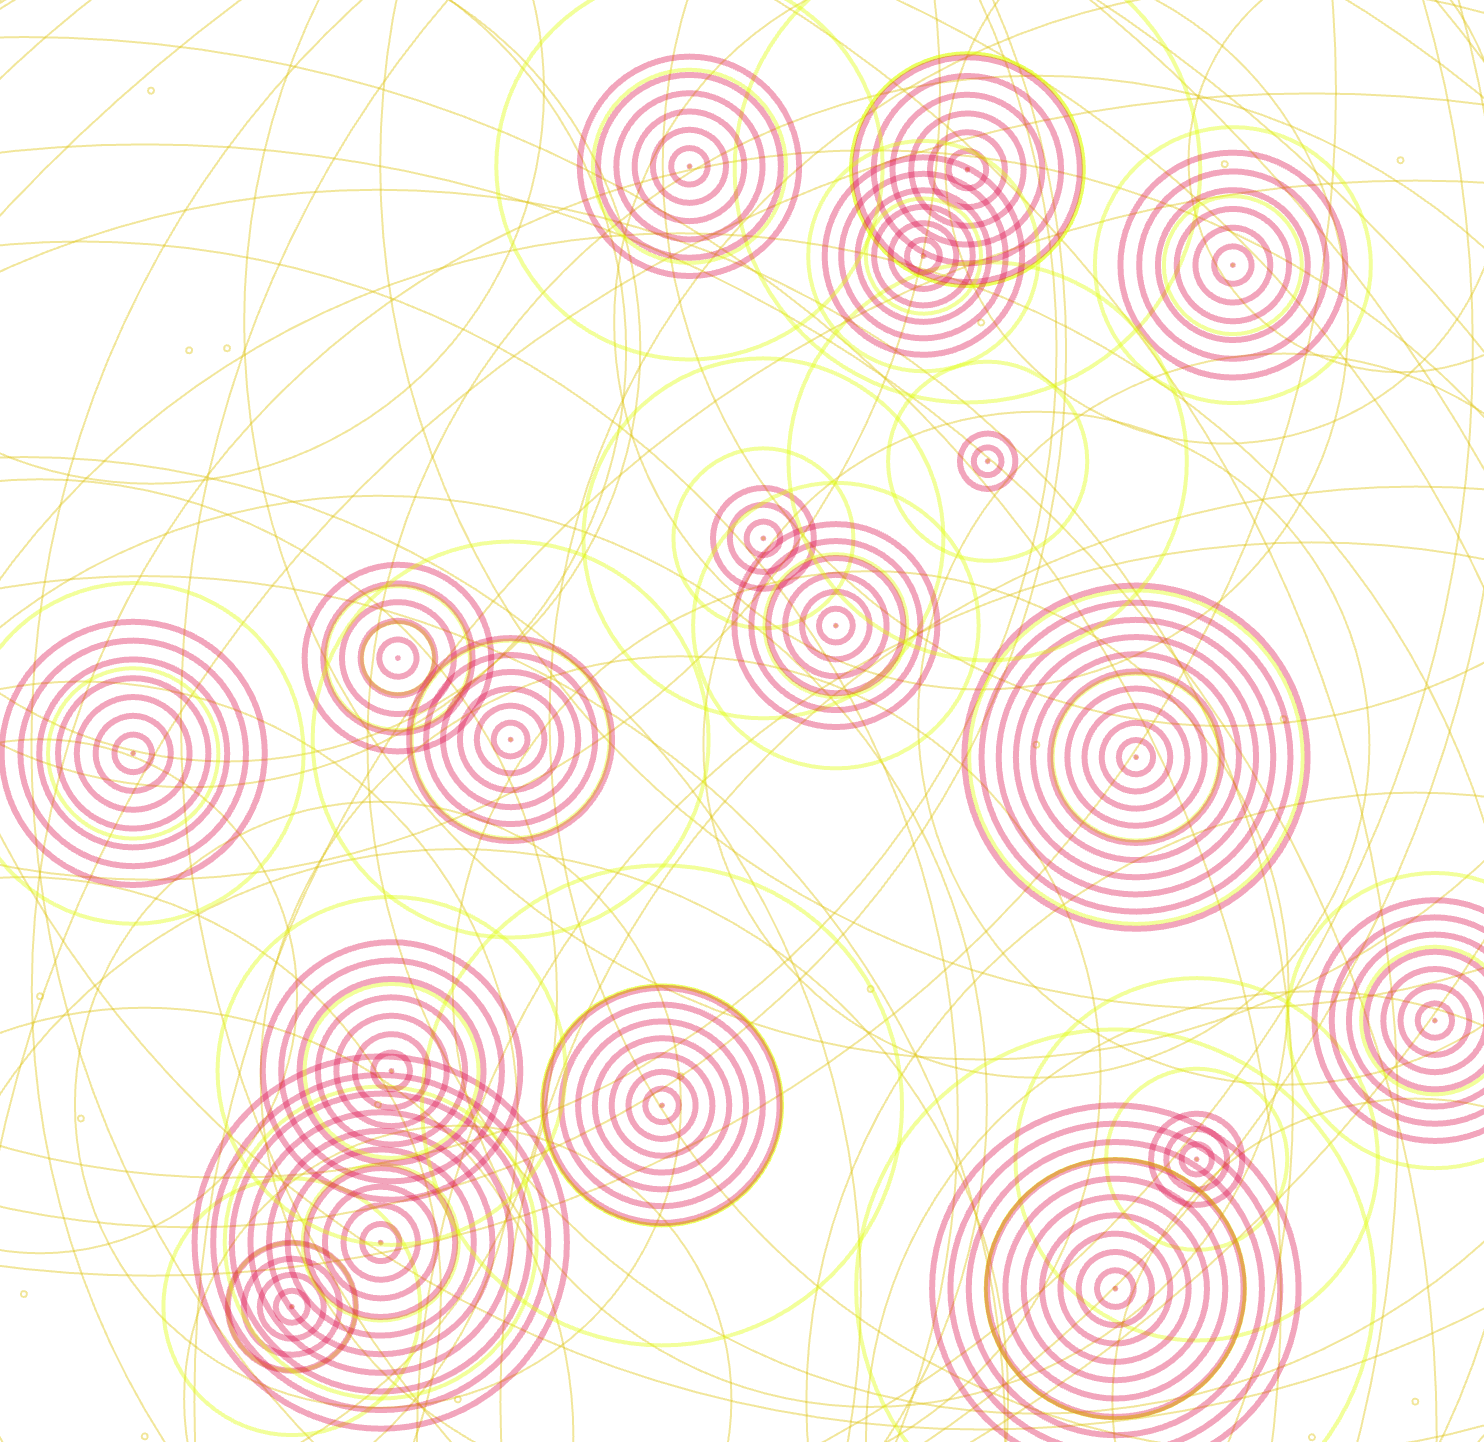
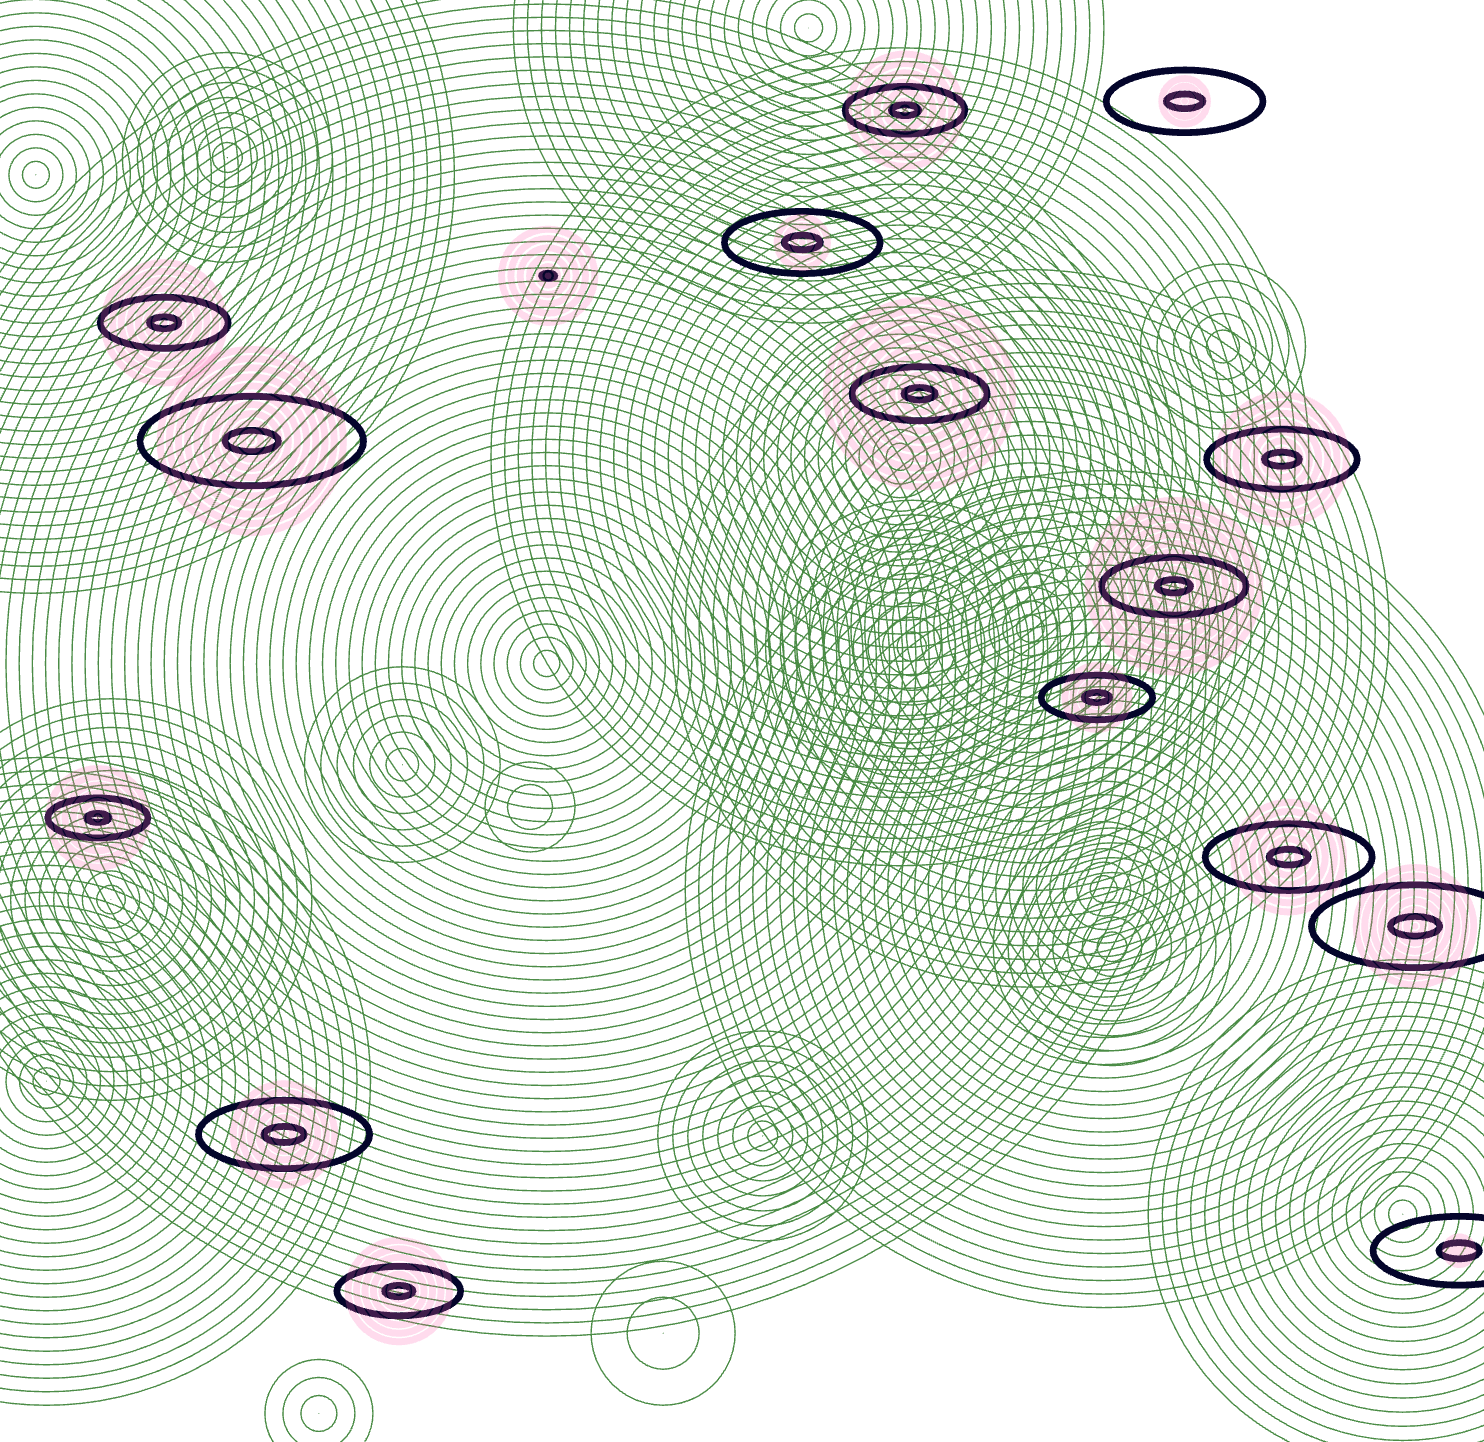
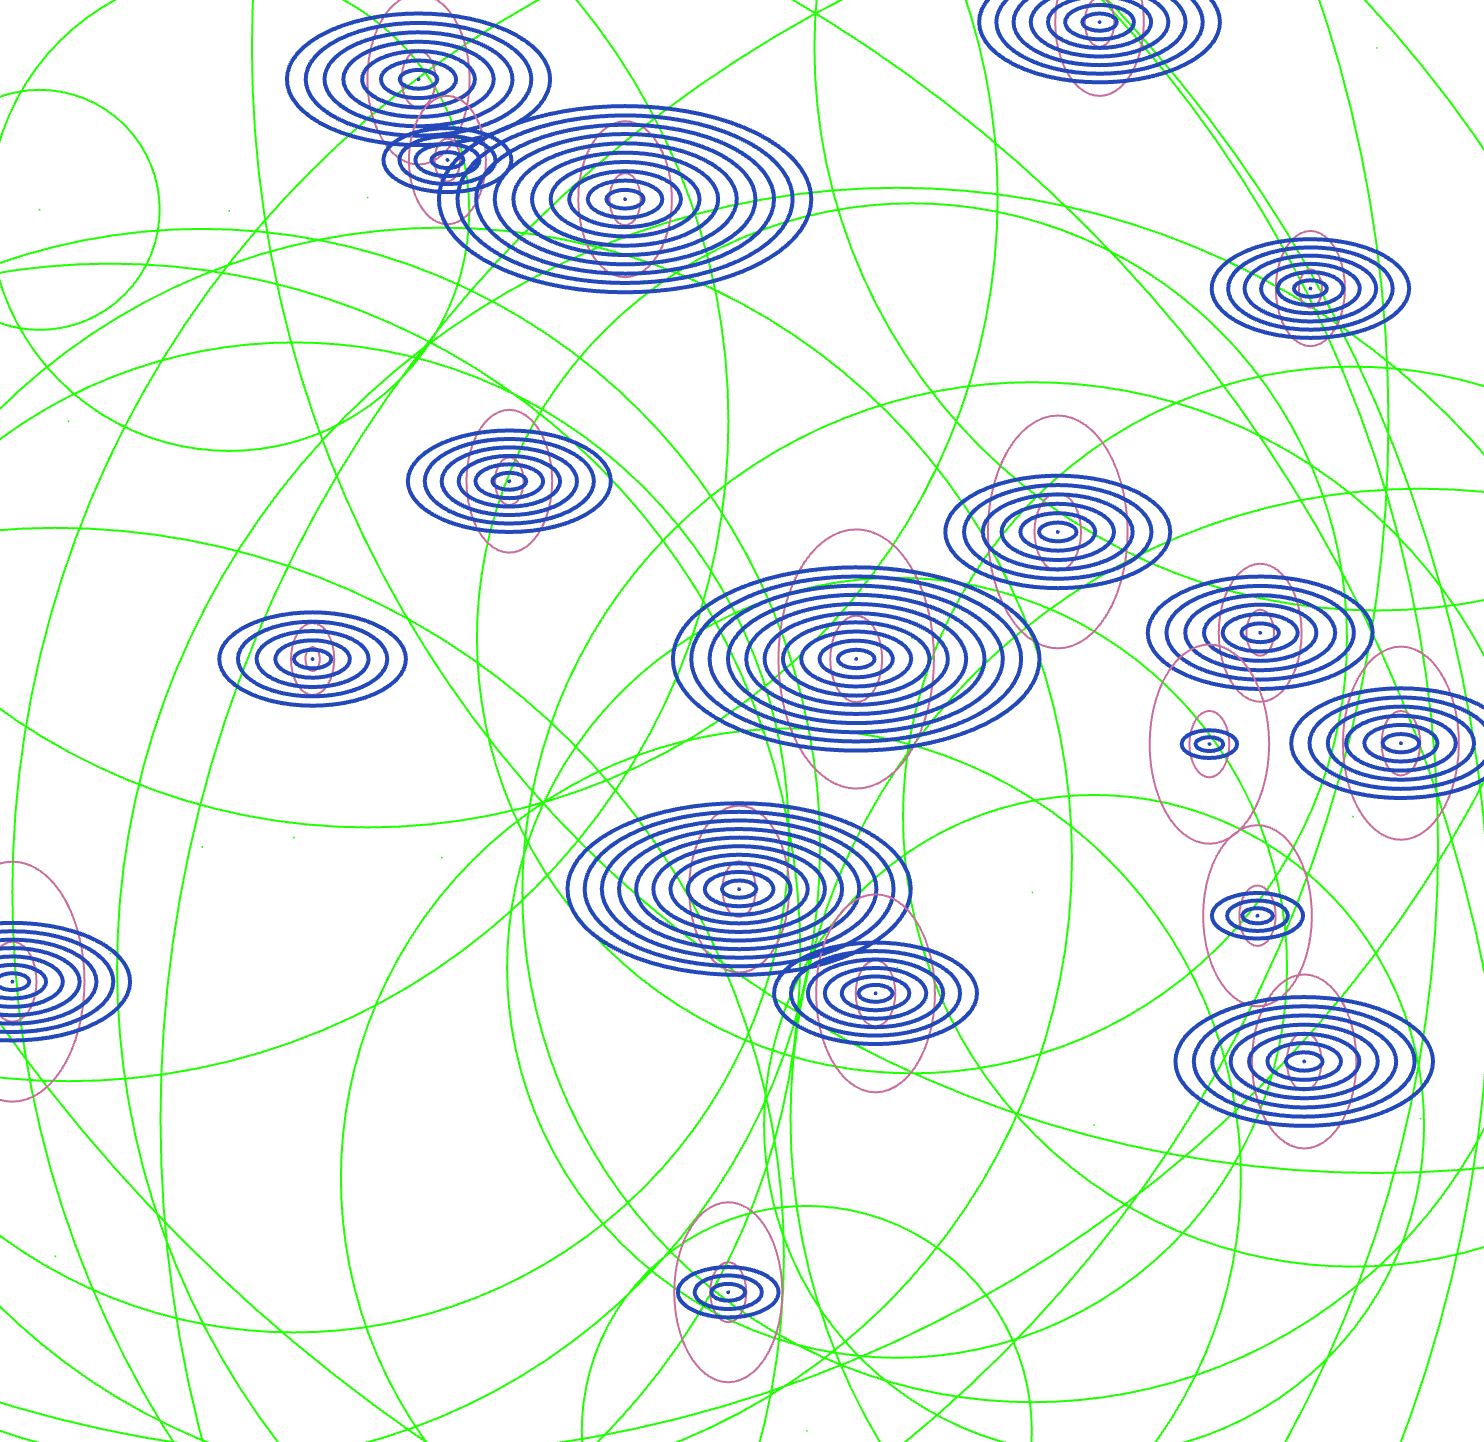
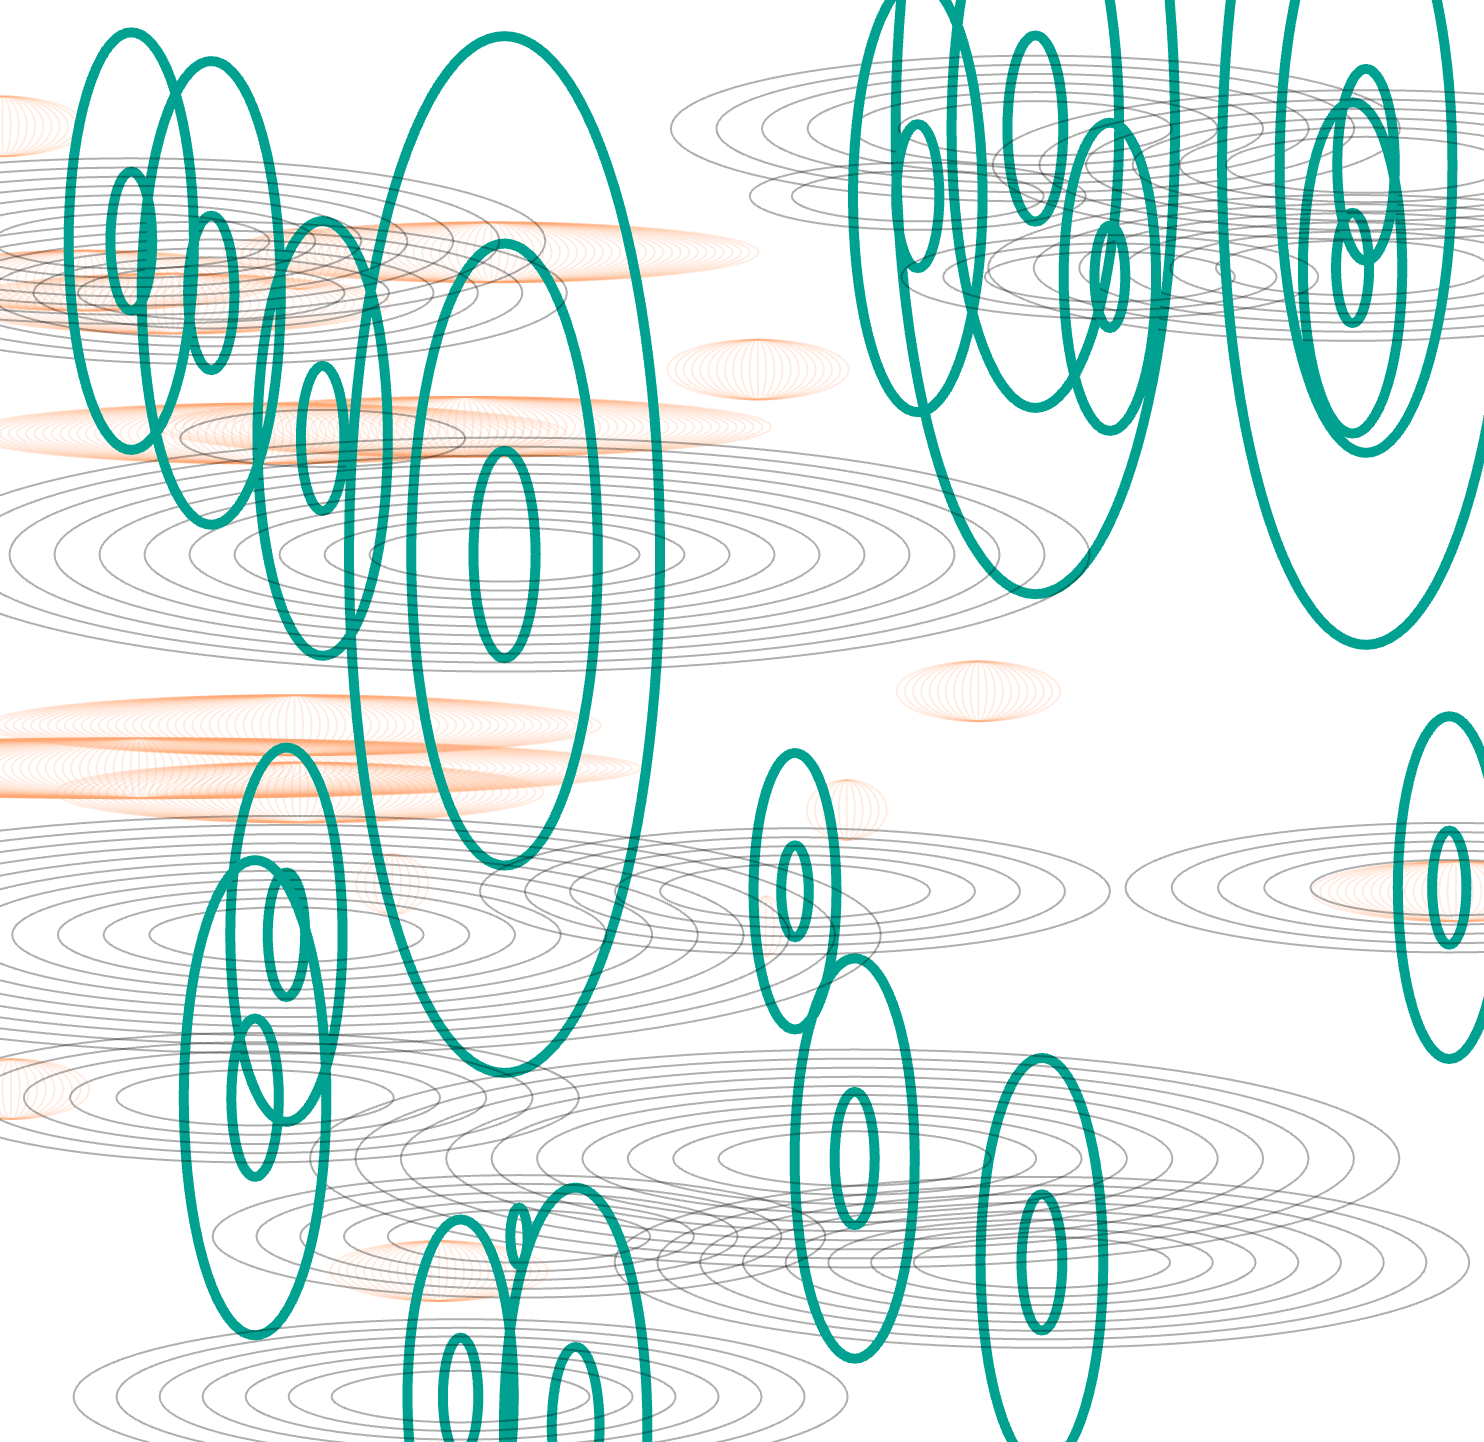
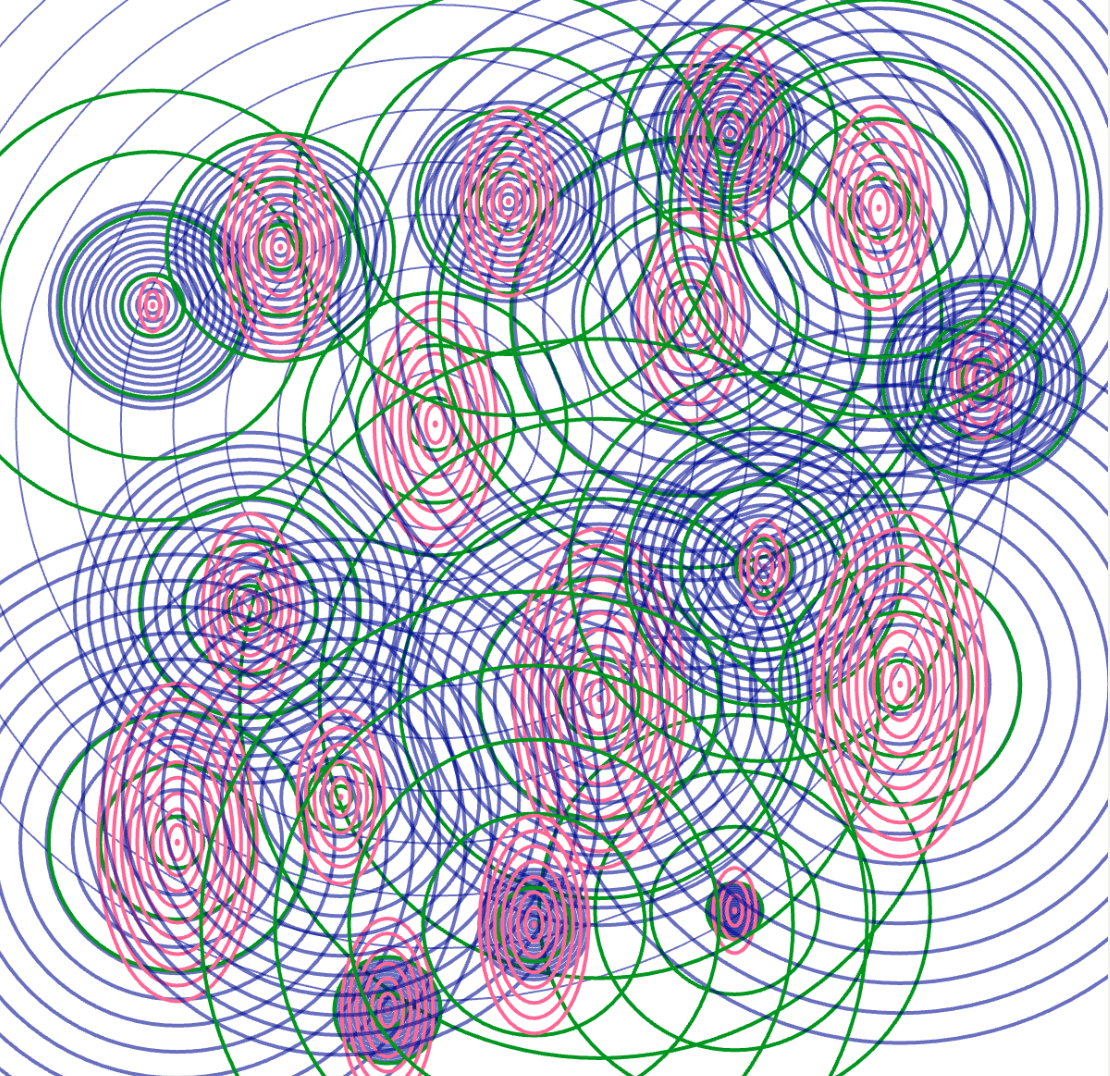
We created three sketches for this experiment, with two inspired by the galaxy. However, we felt these didn’t clearly display the three data sets. Ultimately, we chose the ripple concept, as it most effectively presents the three data. The three distinct colours and ring shapes represent data for blink, pulse, and breath, respectively.
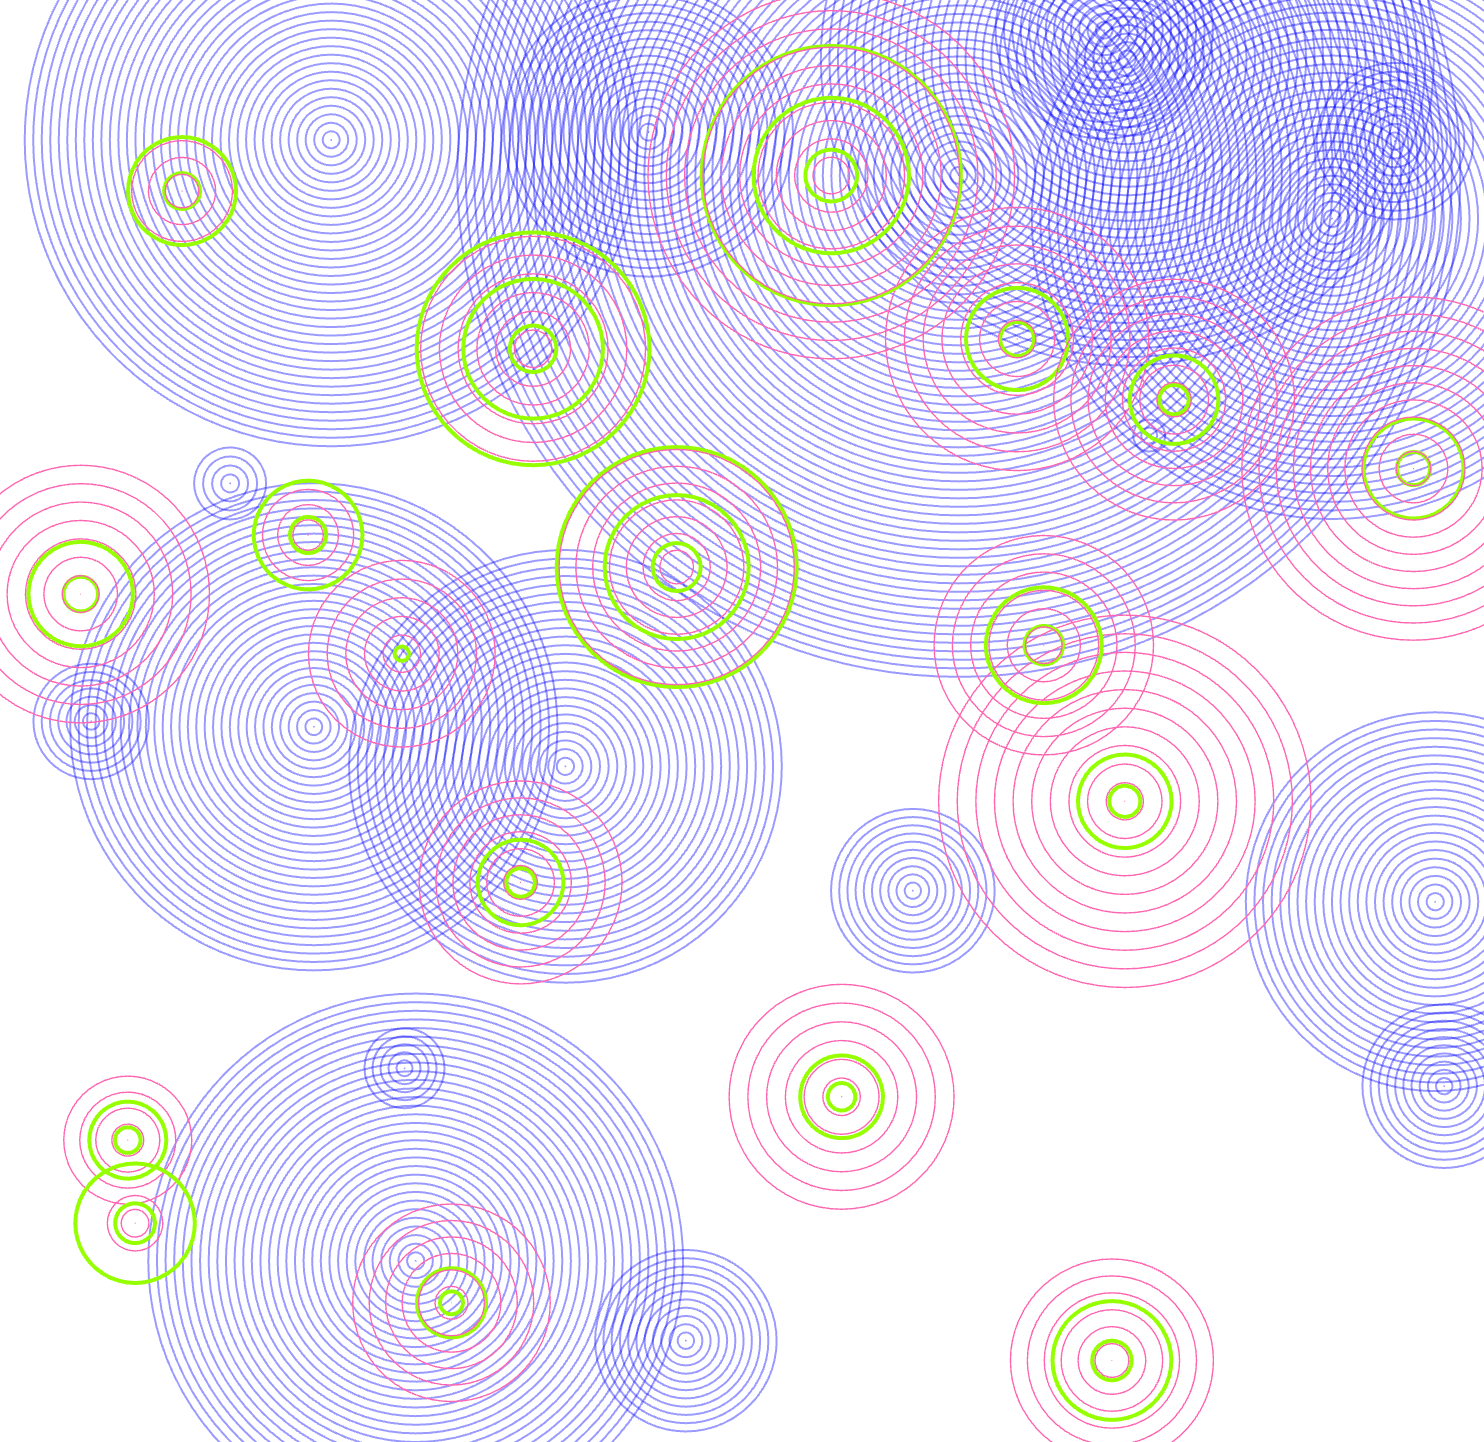
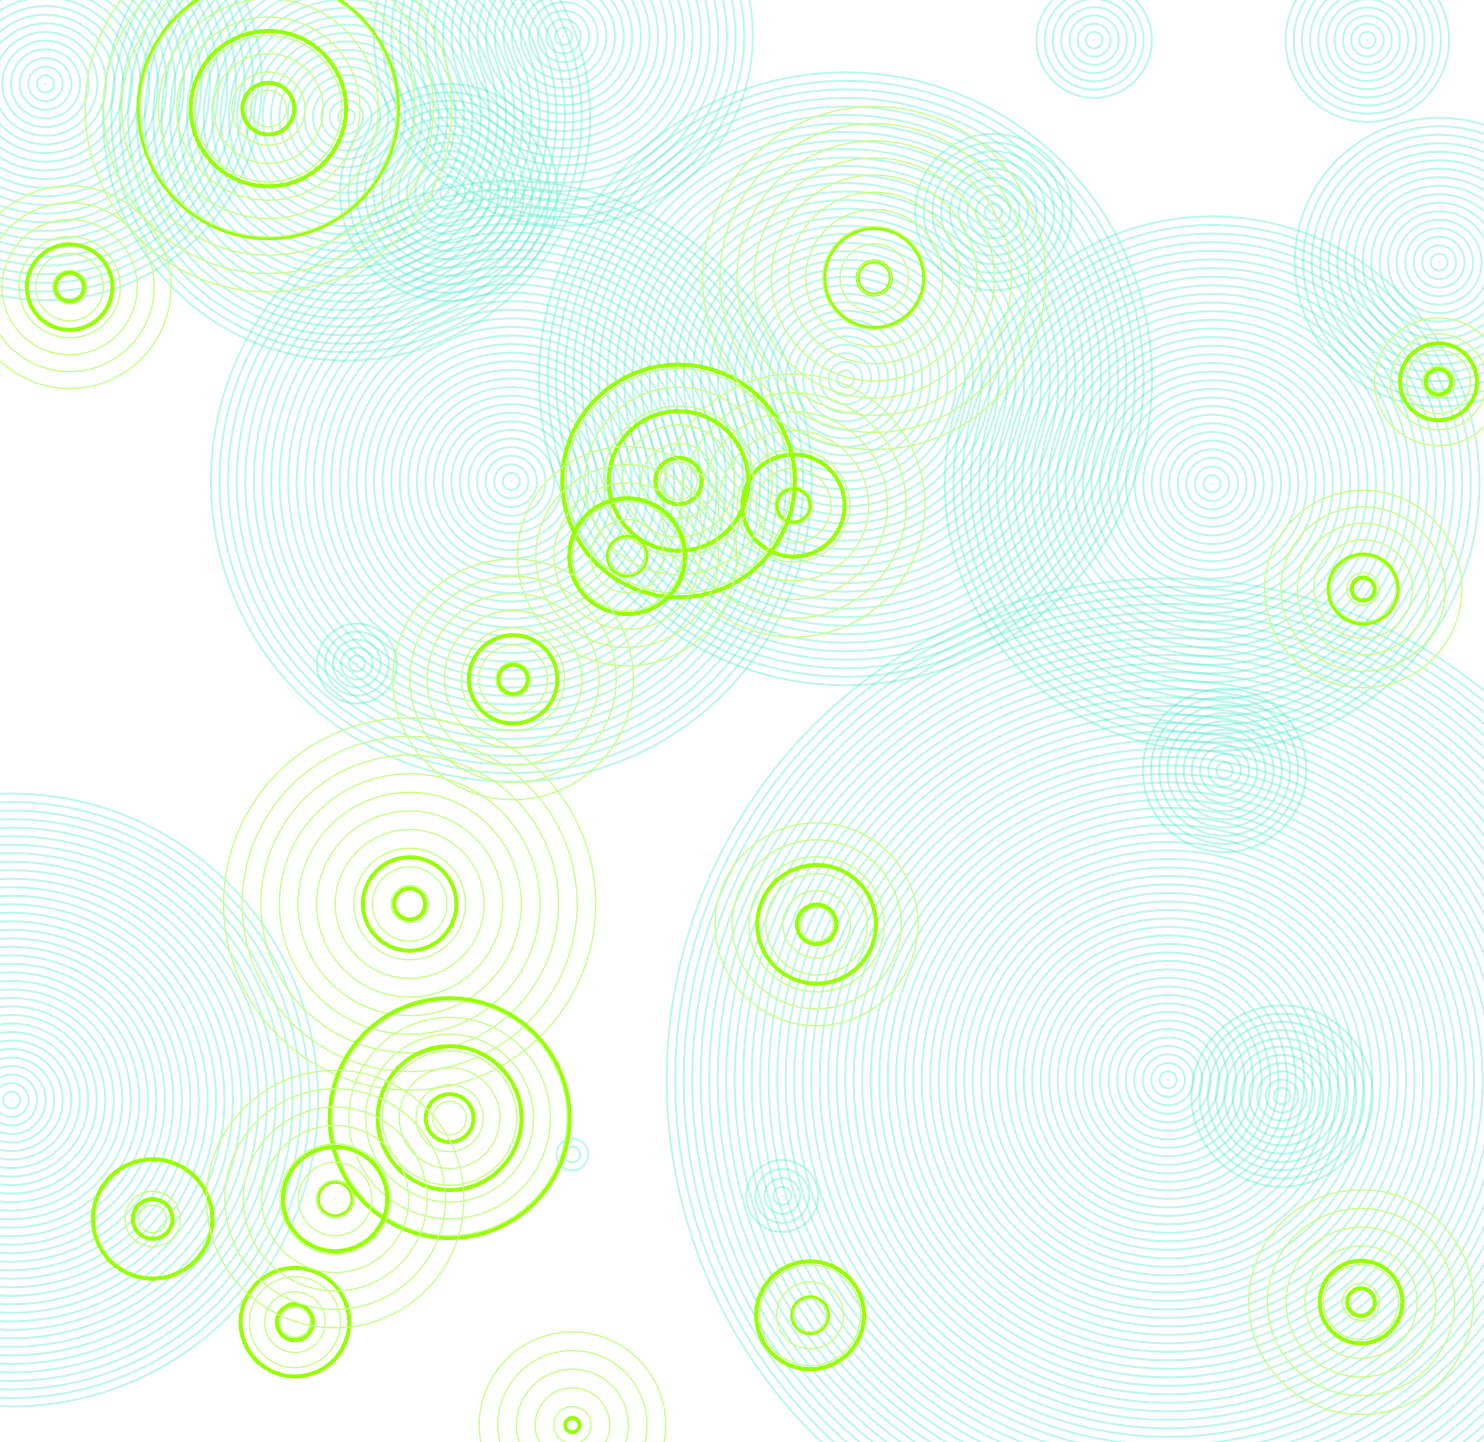
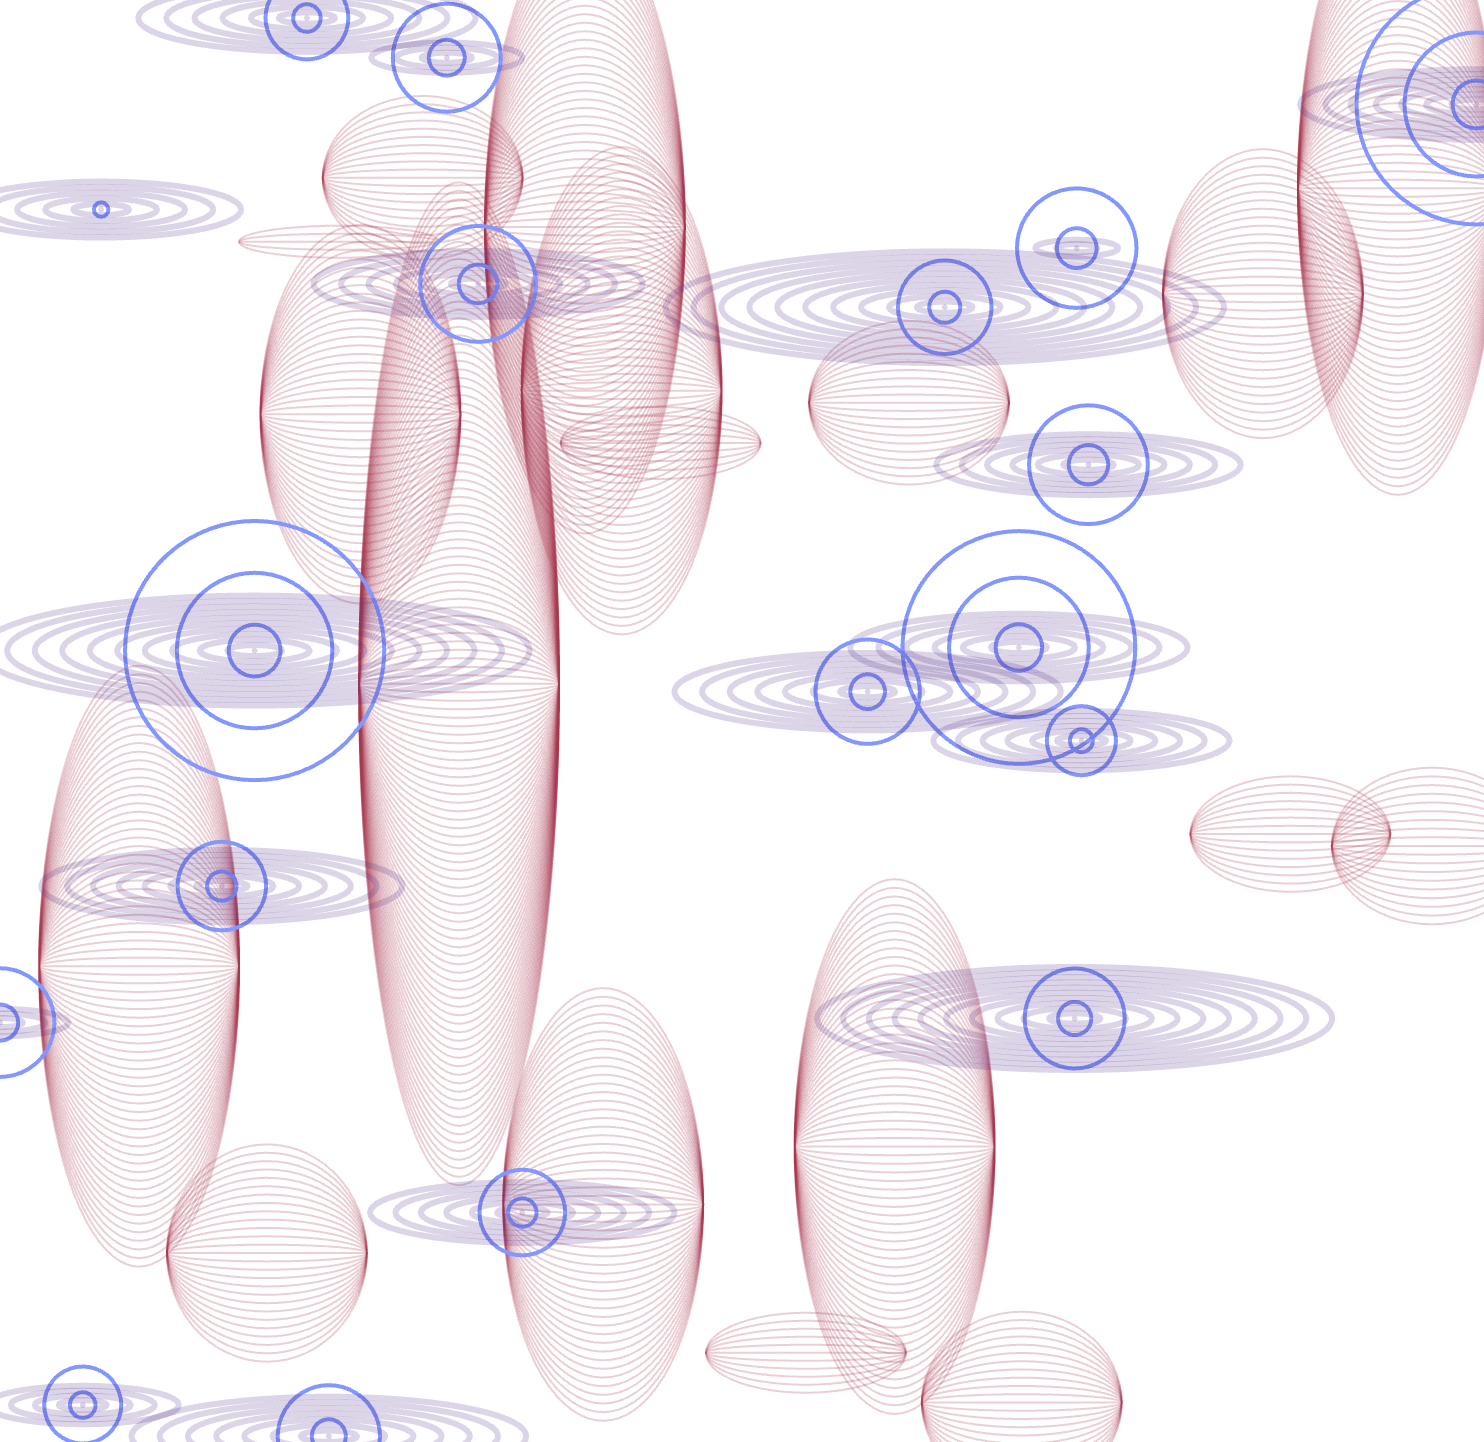
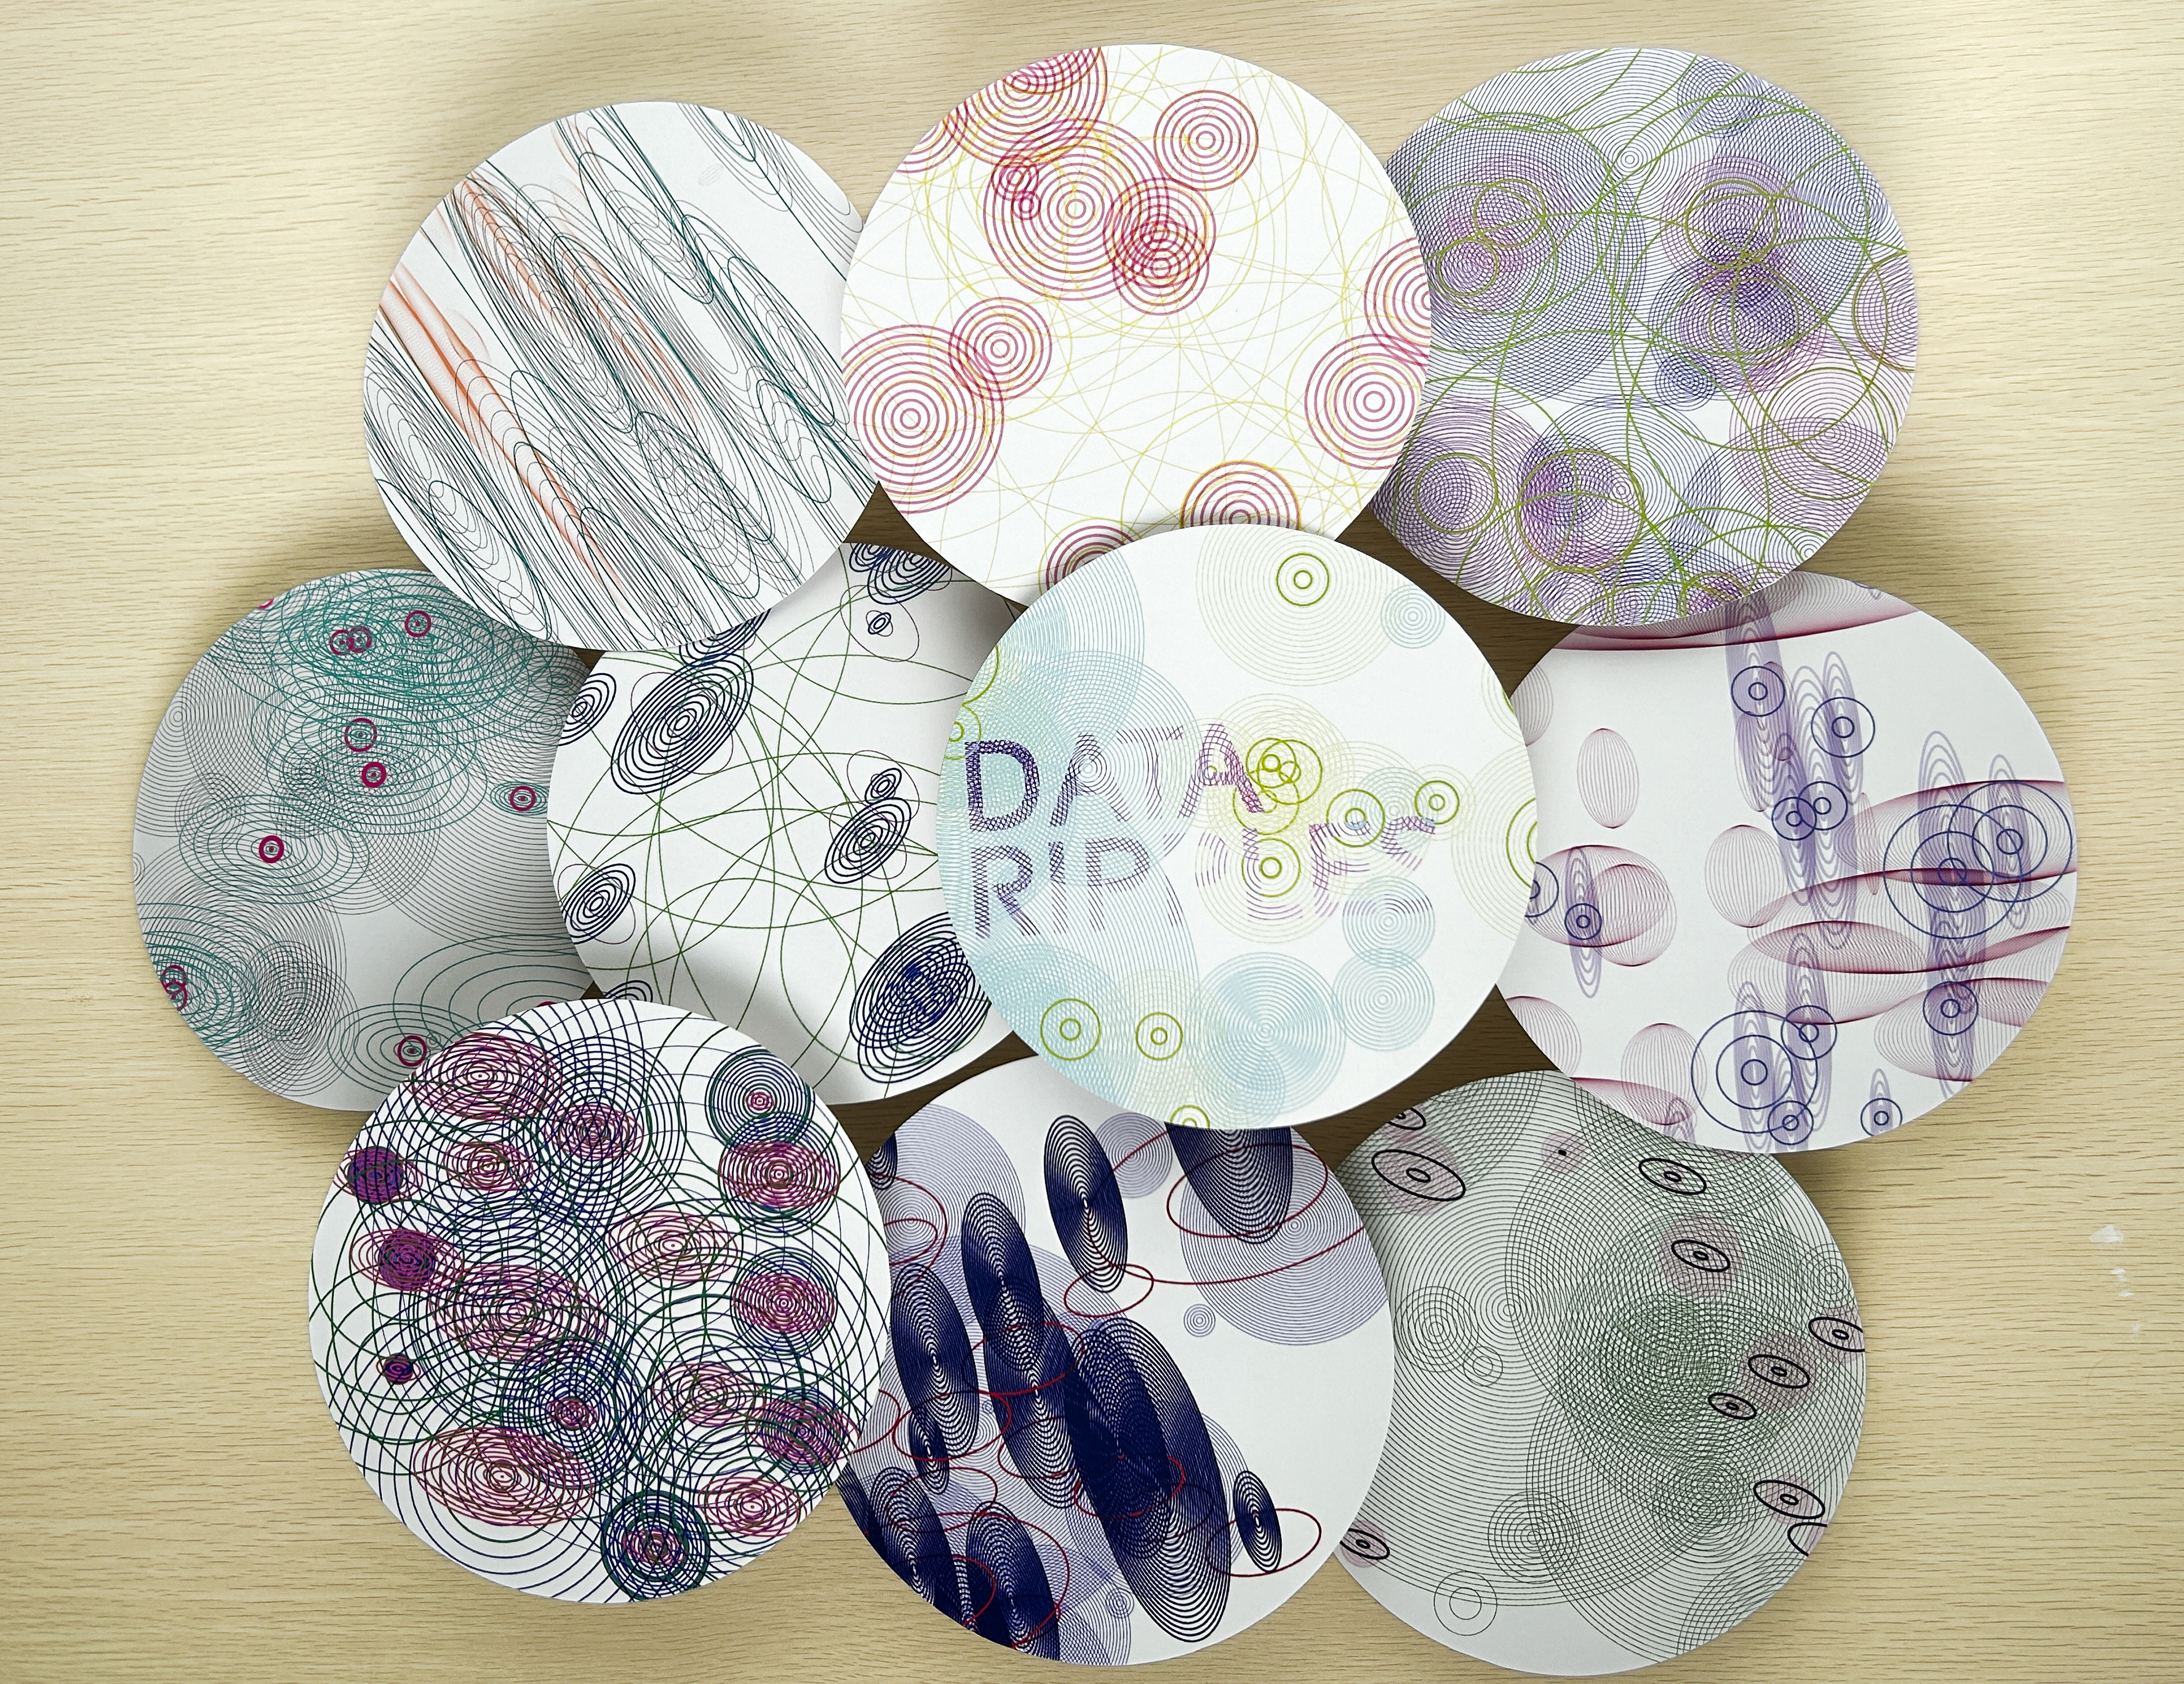
Building on this idea, we varied the values in each sketch to achieve multiple ripple patterns, each representing changes across the three data sets
Poster & Zine
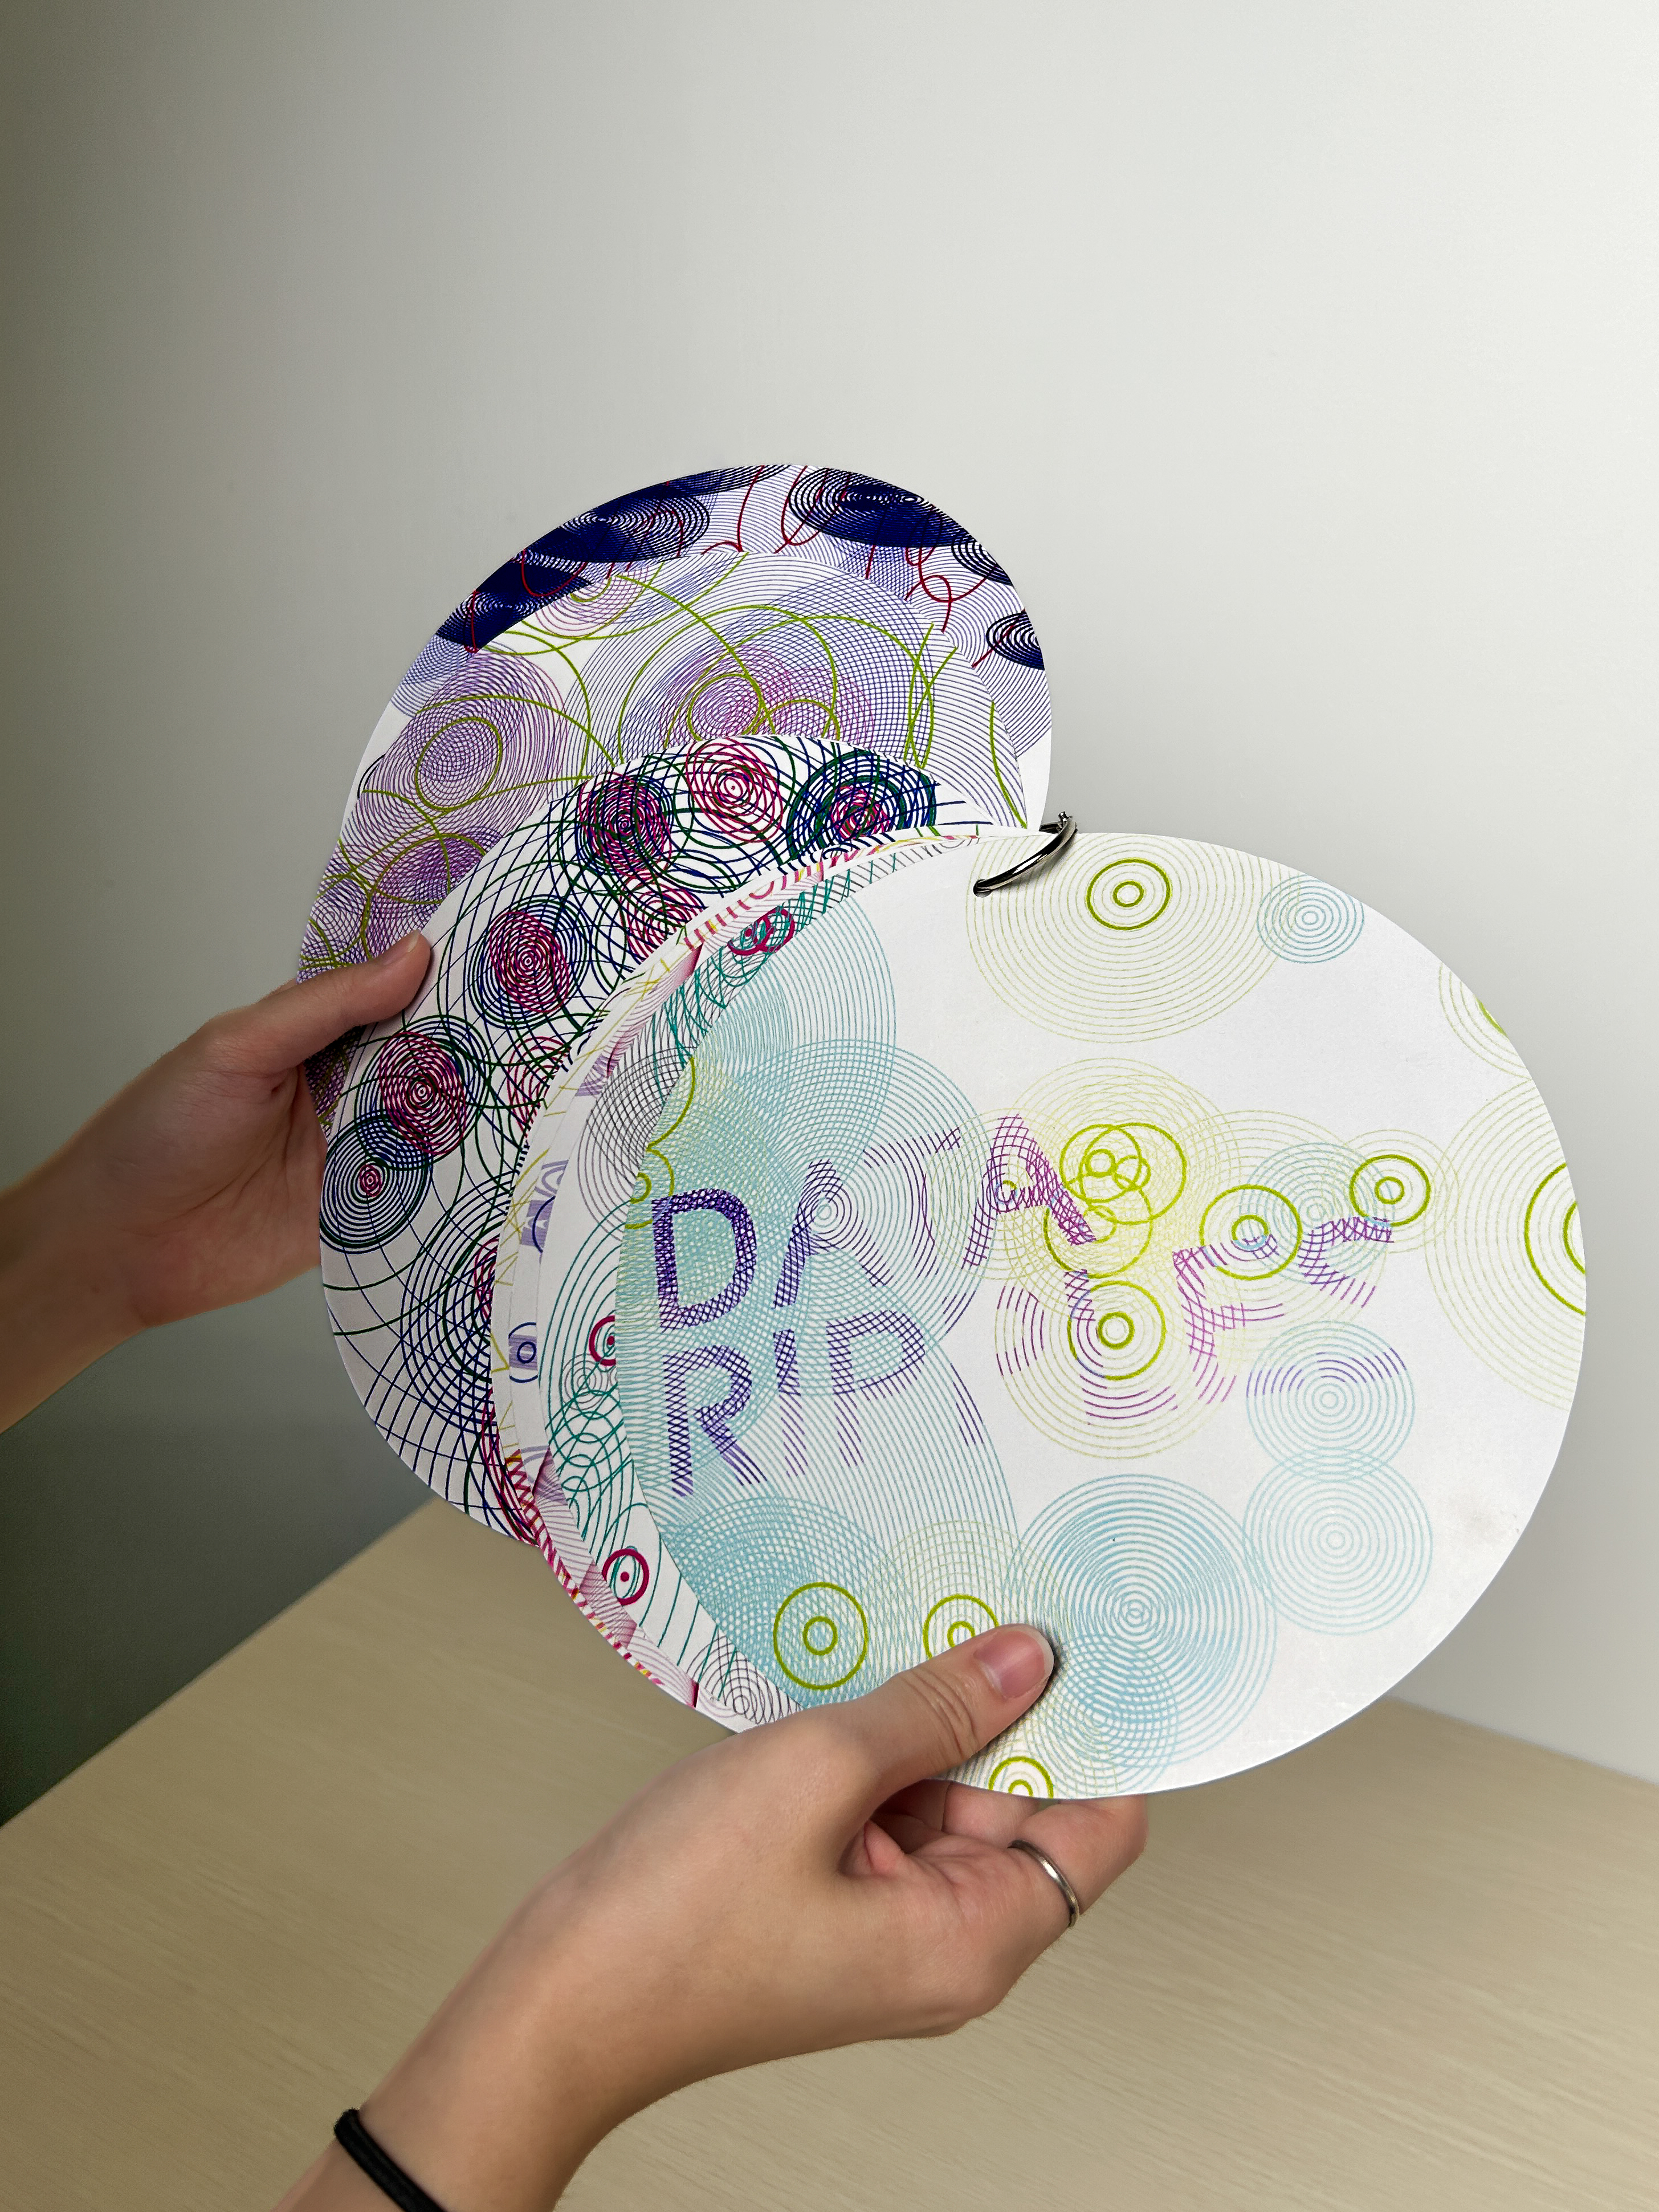
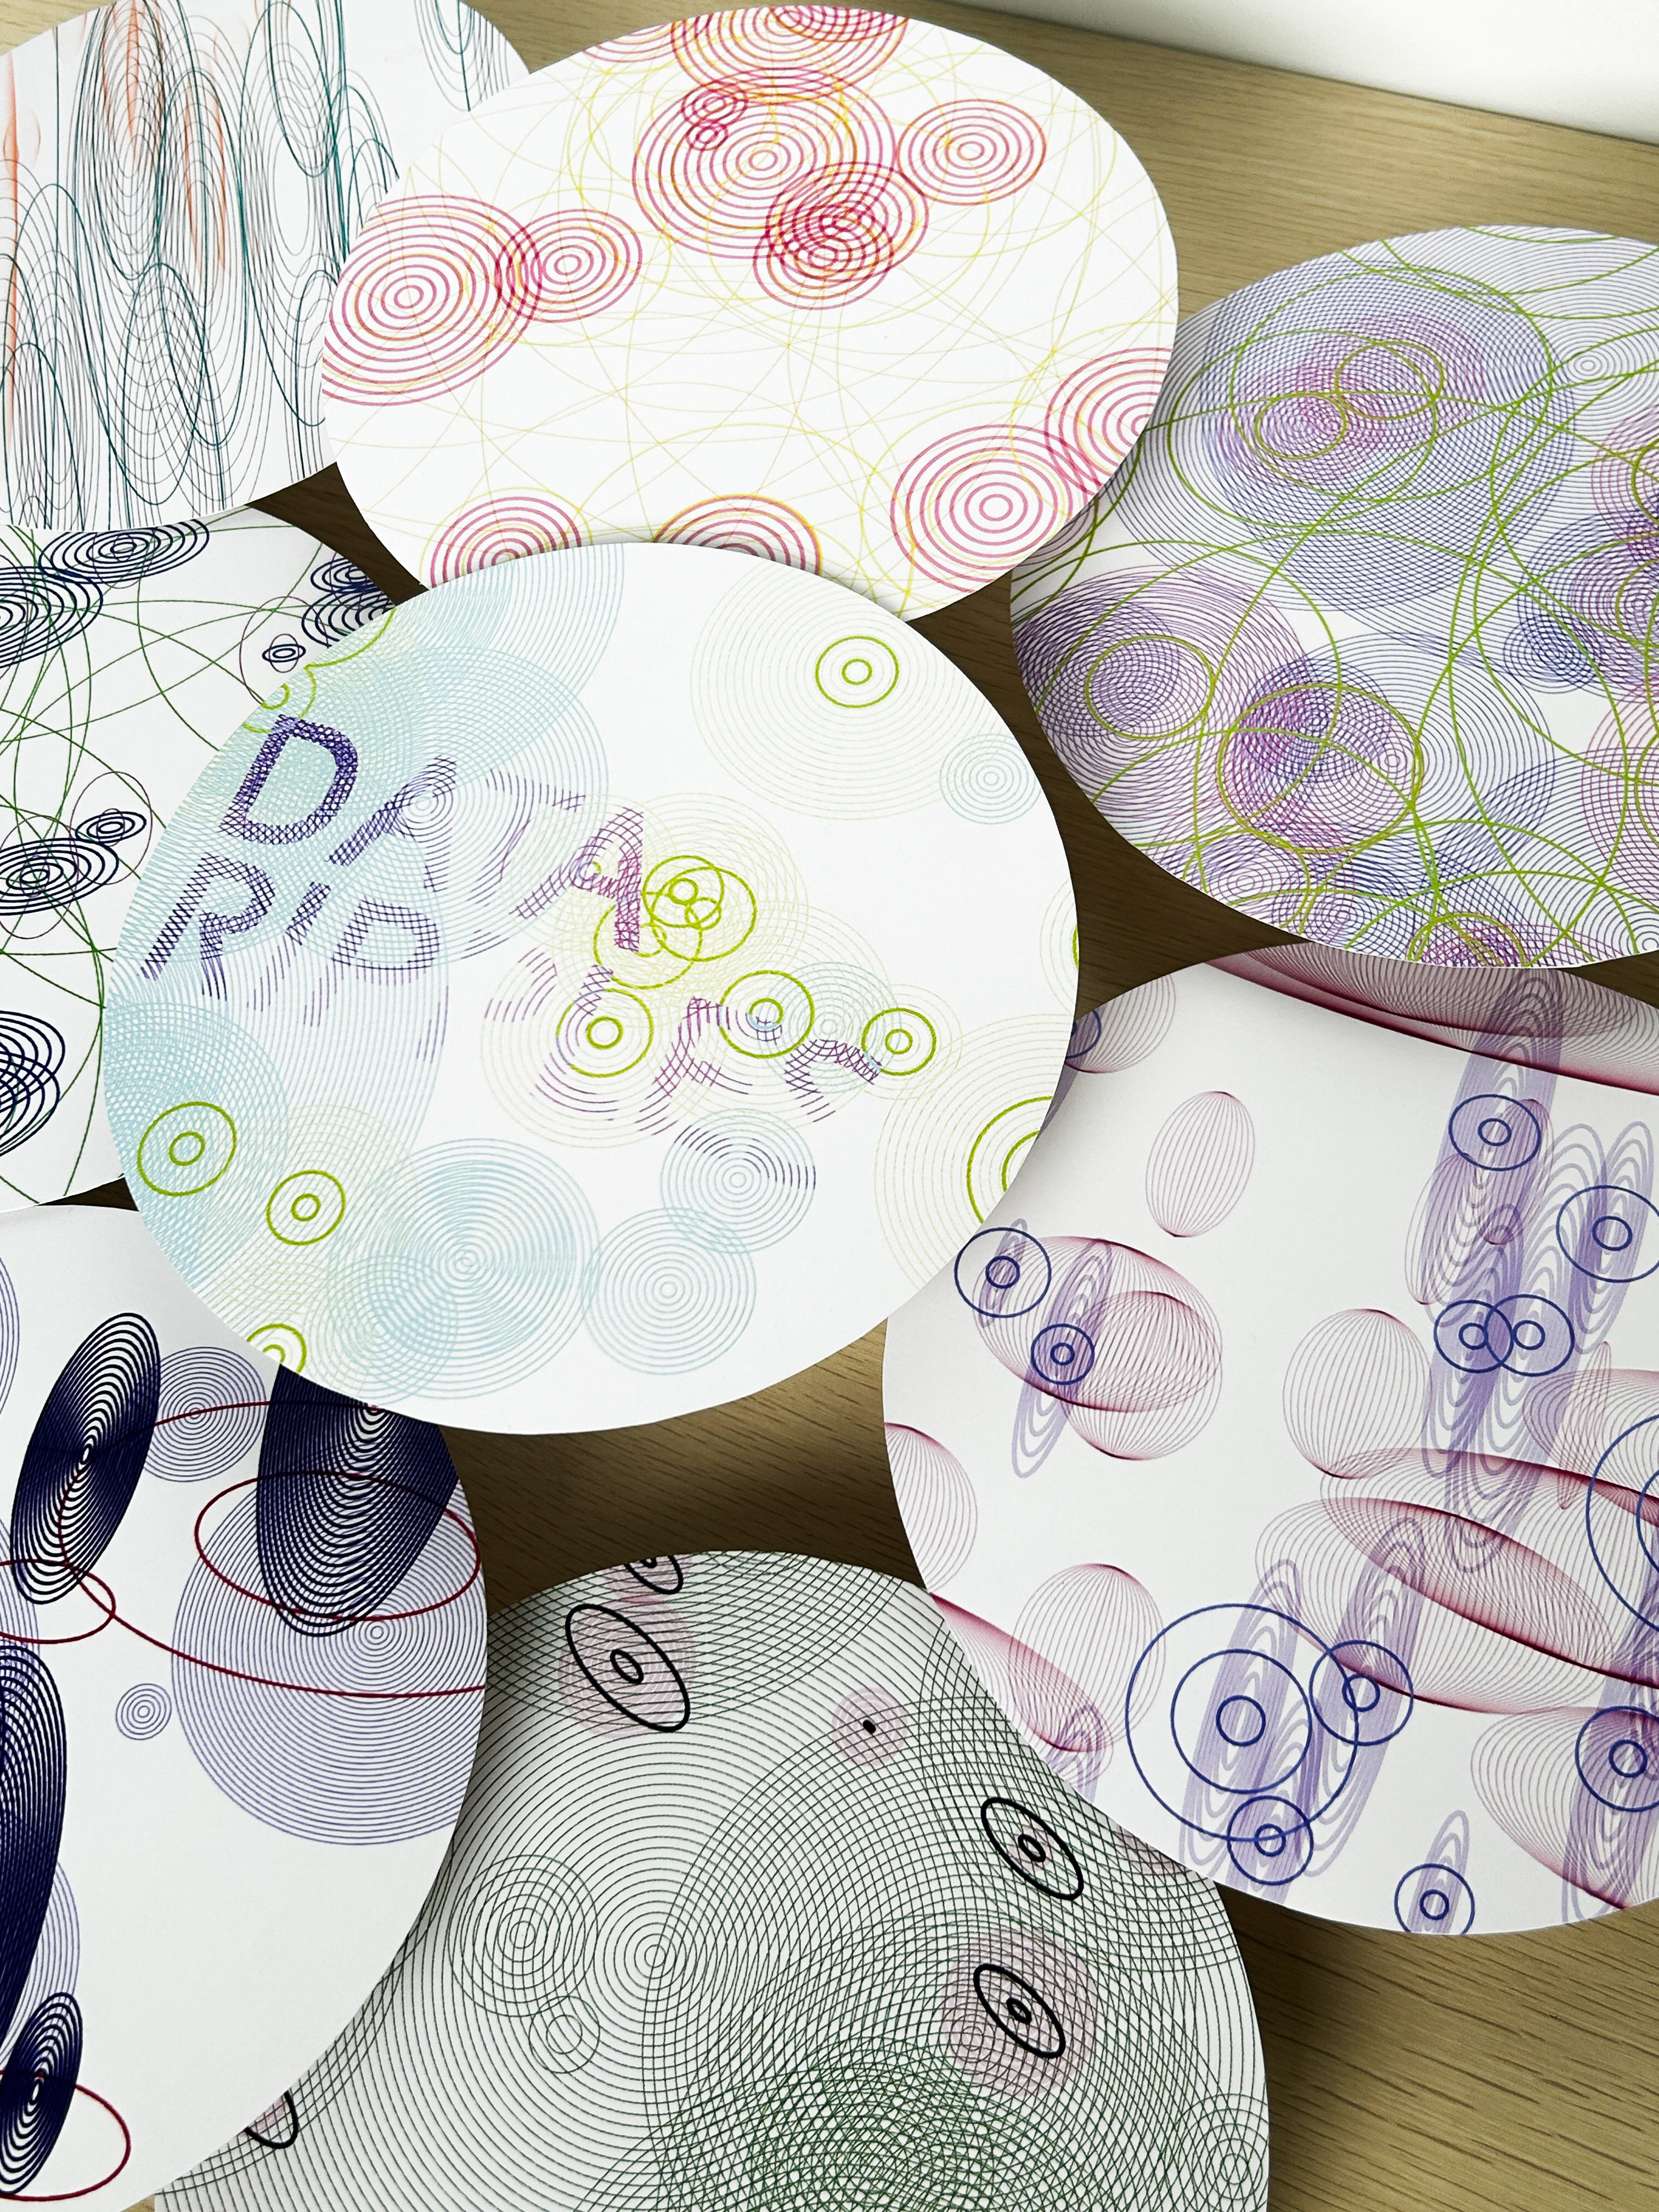
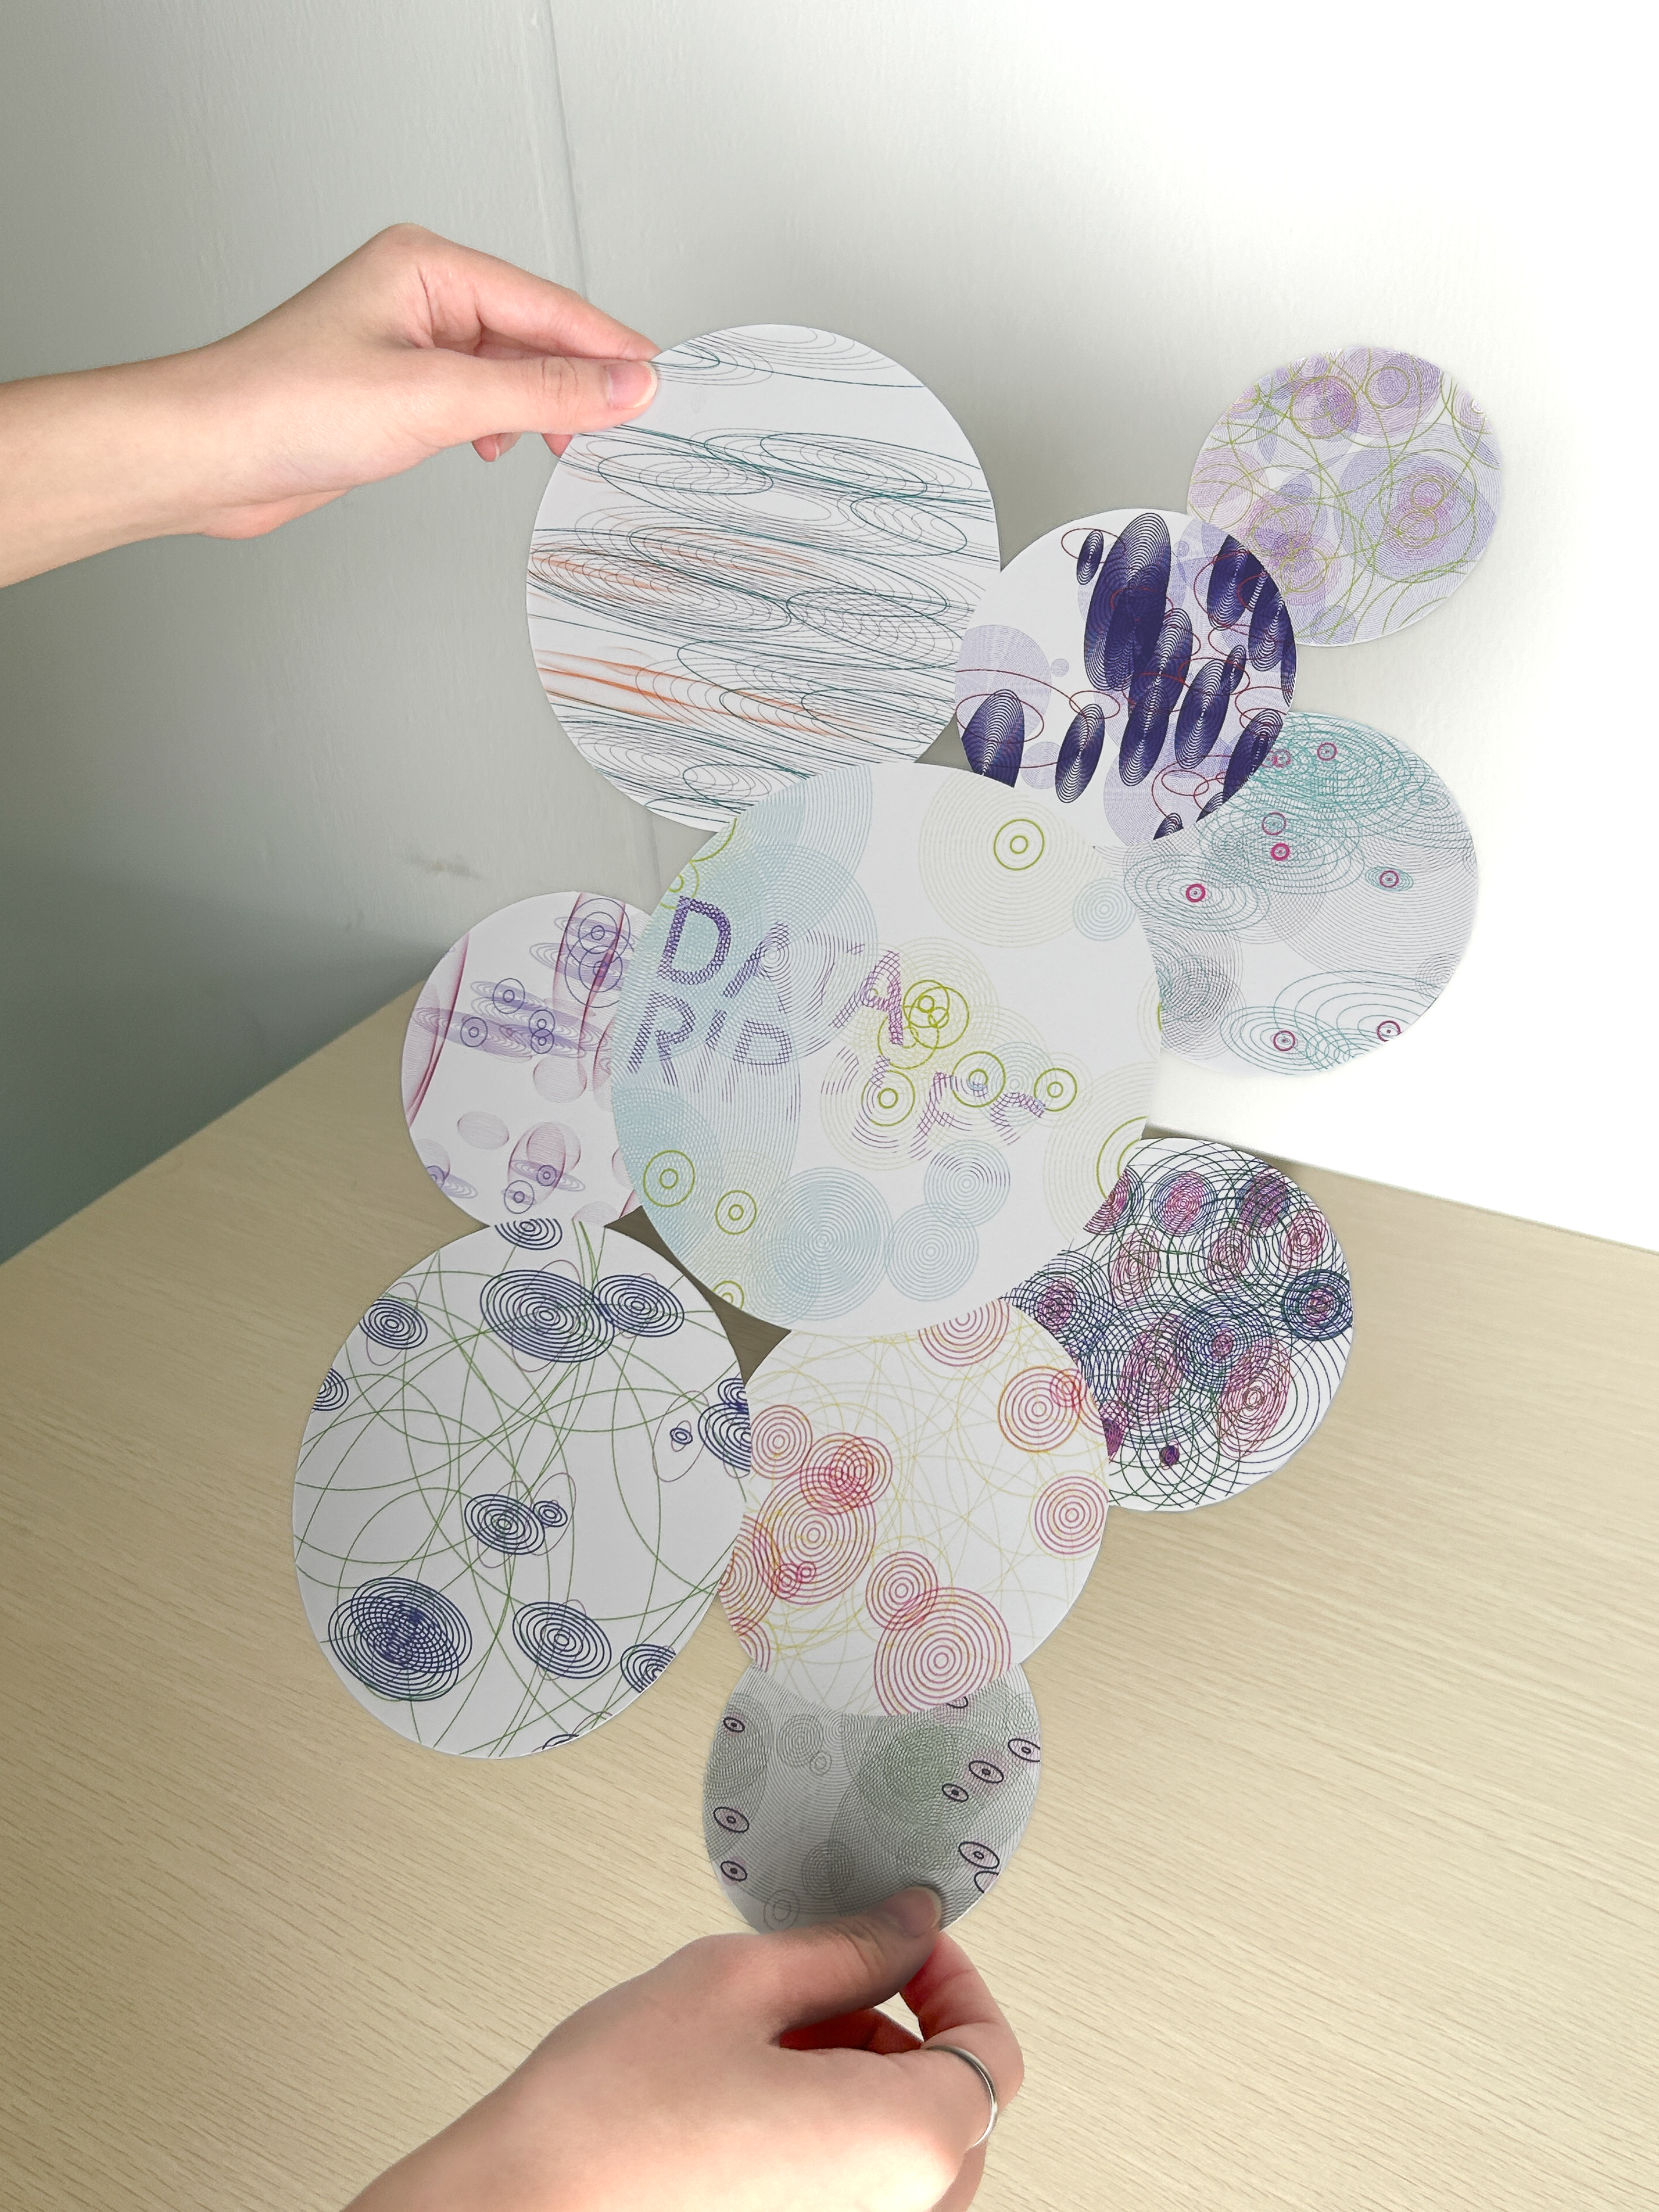
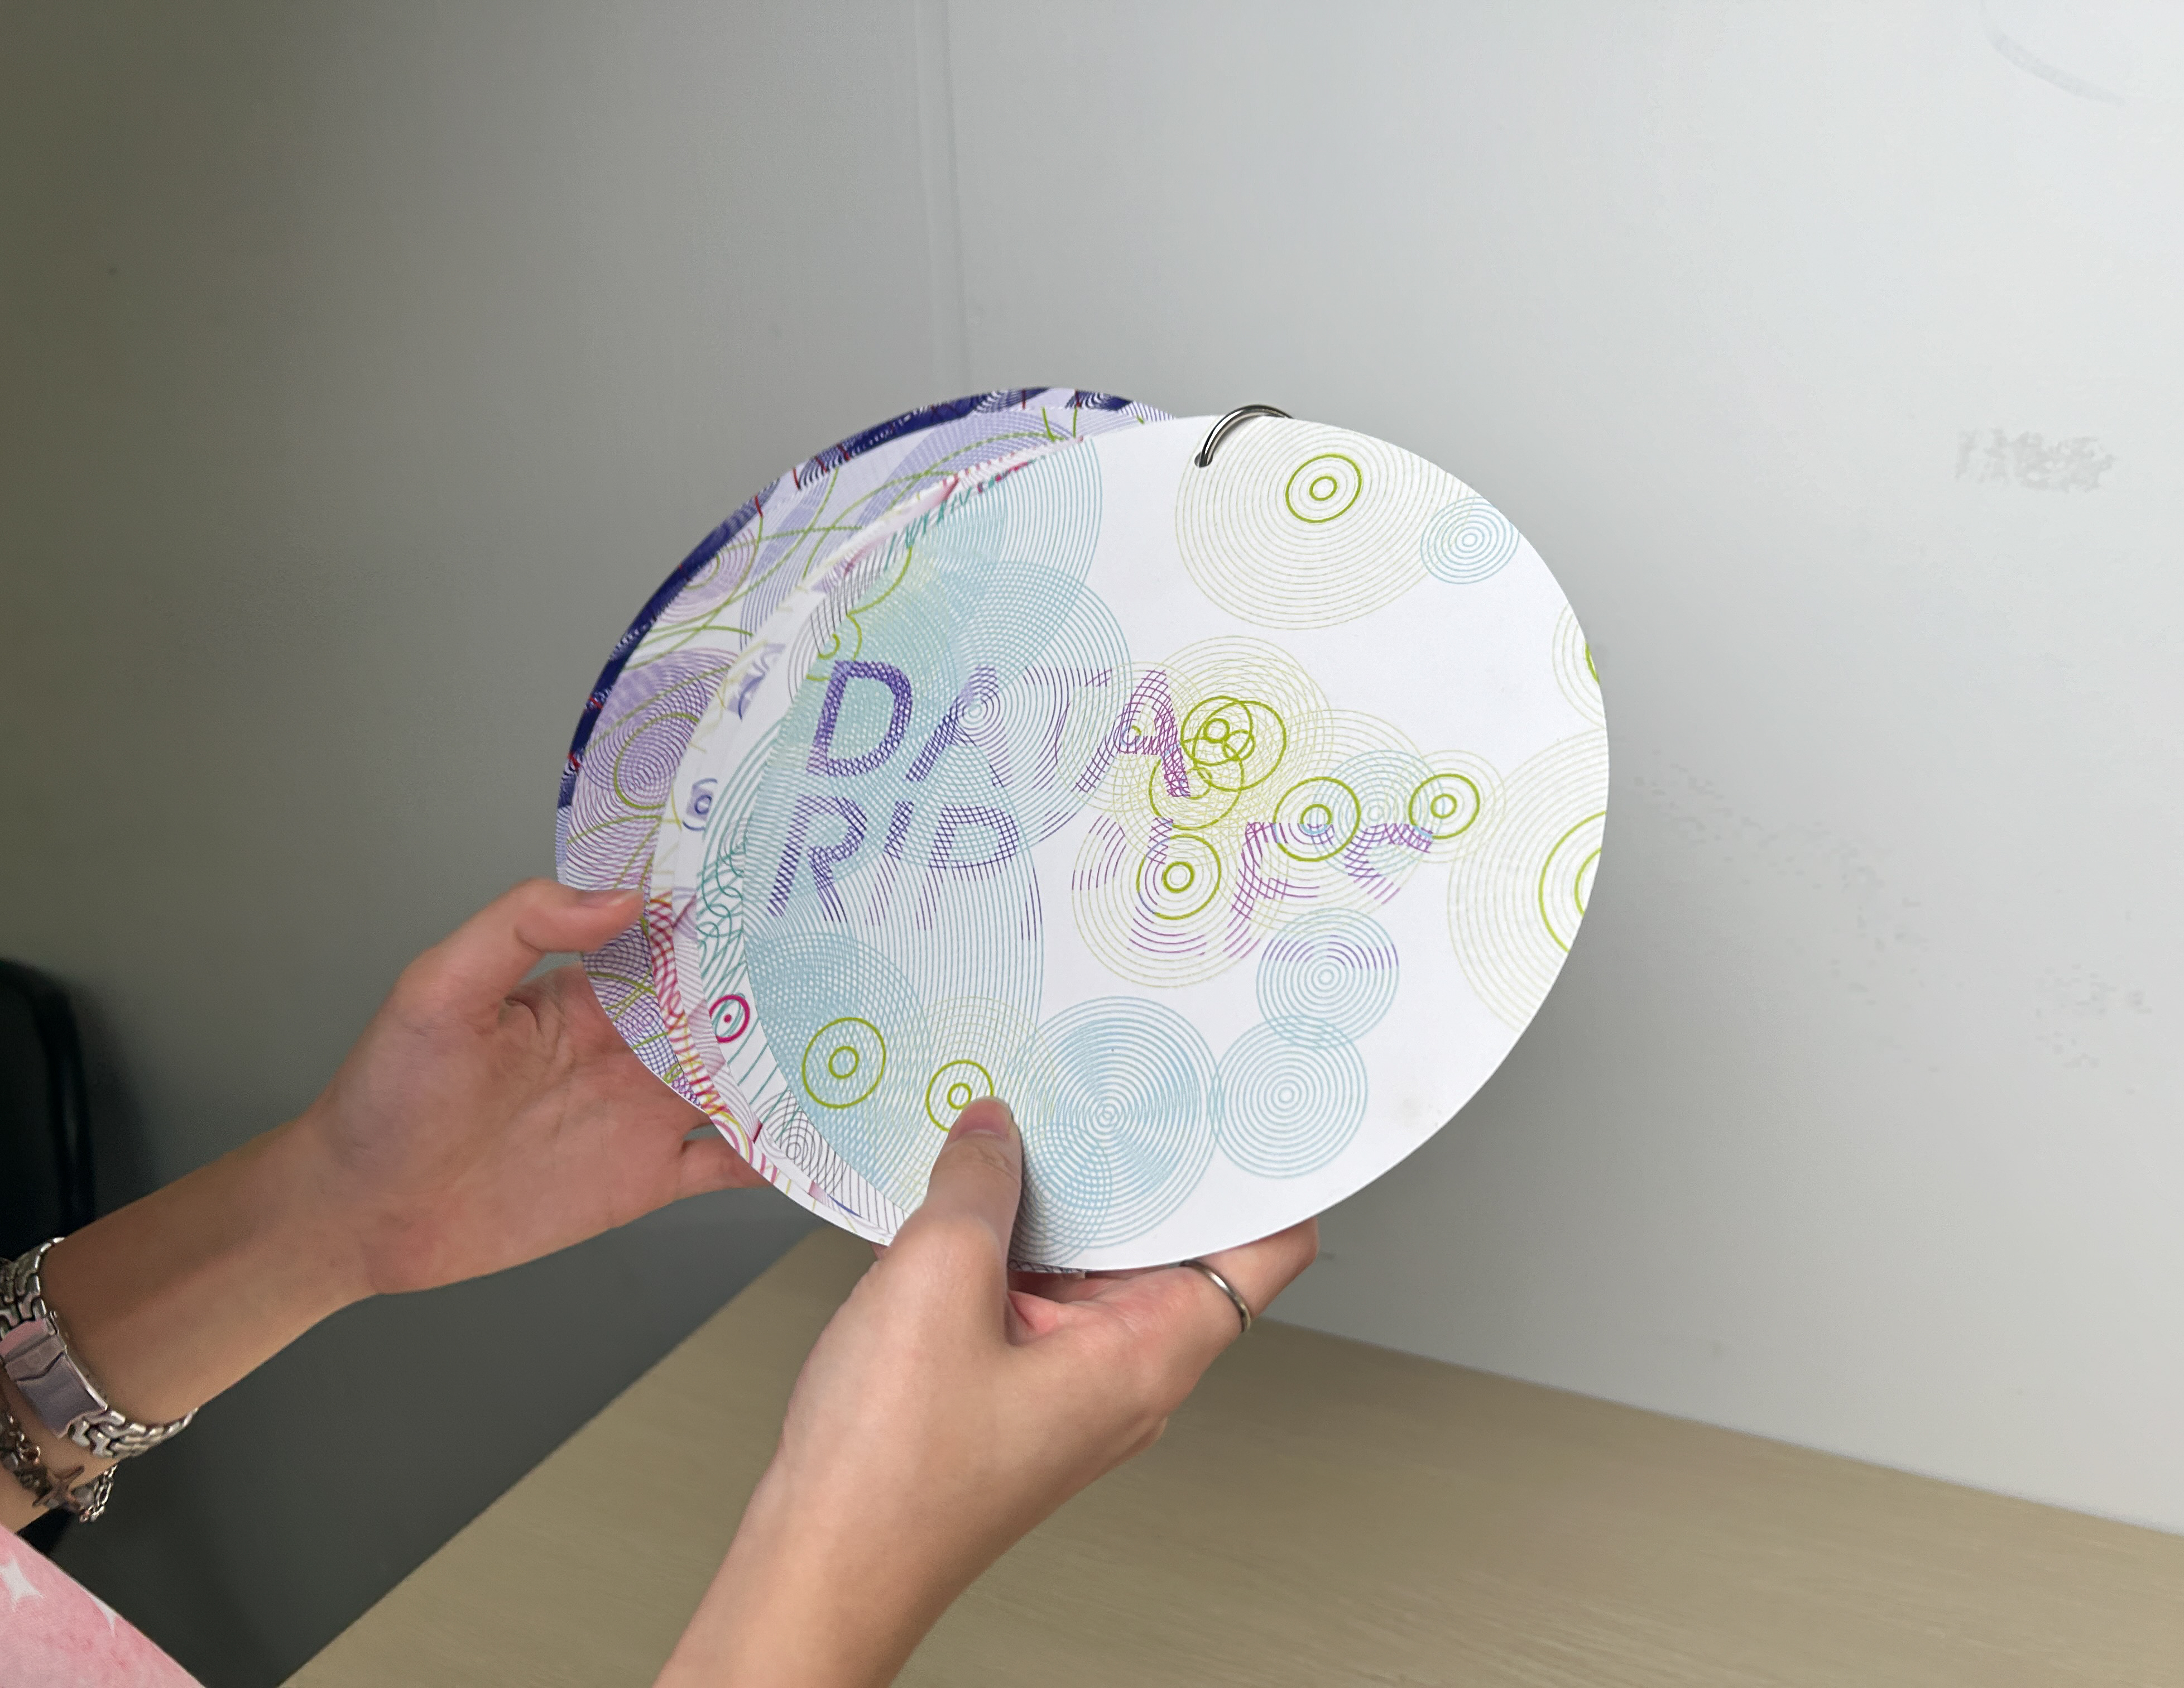
The following are documentations of our physical deliverables, which are the poster and zine. We reflect the shape of the ellipses used in the p5.js sketch onto the form of the poster and zine. We chose an elliptical form for the zine to represent the shape of ripples, aiming for a pond-like effect when the overlapping ellipses are displayed together.
-
Our main challenge was combining the three data sets into clear, cohesive patterns. We brainstormed several ideas, but due to limitations in coding skills, many concepts didn’t turn out as expected. However, the process became smoother once we explored the ripple idea. We enjoyed seeing how each adjustment in the sketch produced unique patterns.